More information on how to use the map can be found underneath the interactive and historical maps below
In the event that the embedded map displays incorrectly, please view the map in ArcGIS.
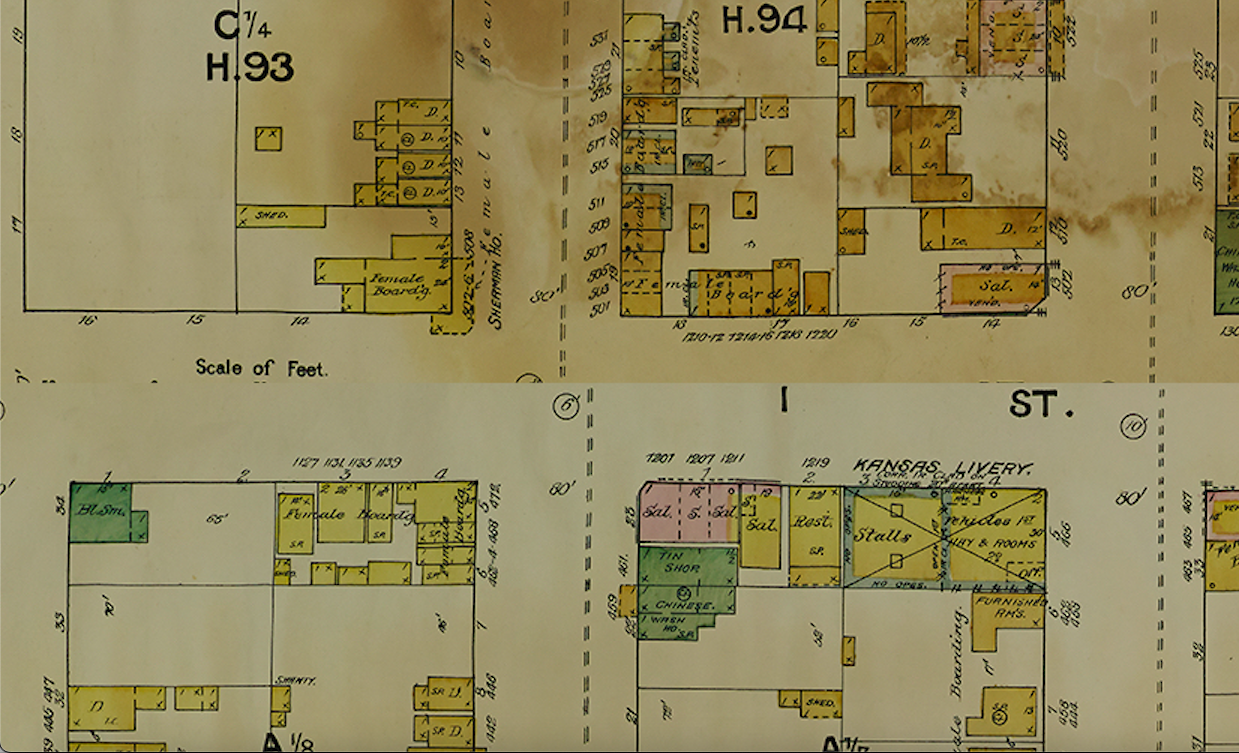
Third and I street intersection, with Chinatown below. (Drag image to new window to expand) Sanborn Insurance Maps, San Diego [1888], Library of Congress.
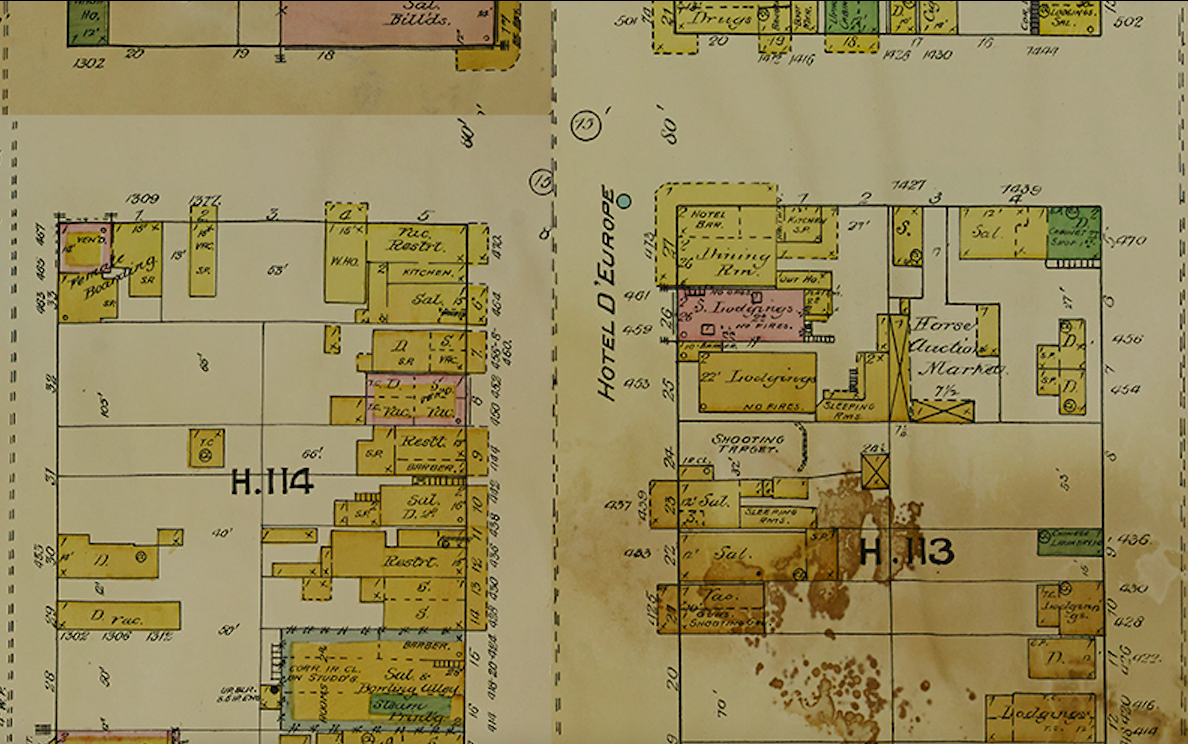
Fifth and I streets (Drag image to new window to expand) Sanborn Insurance Maps, San Diego [1888], Library of Congress.
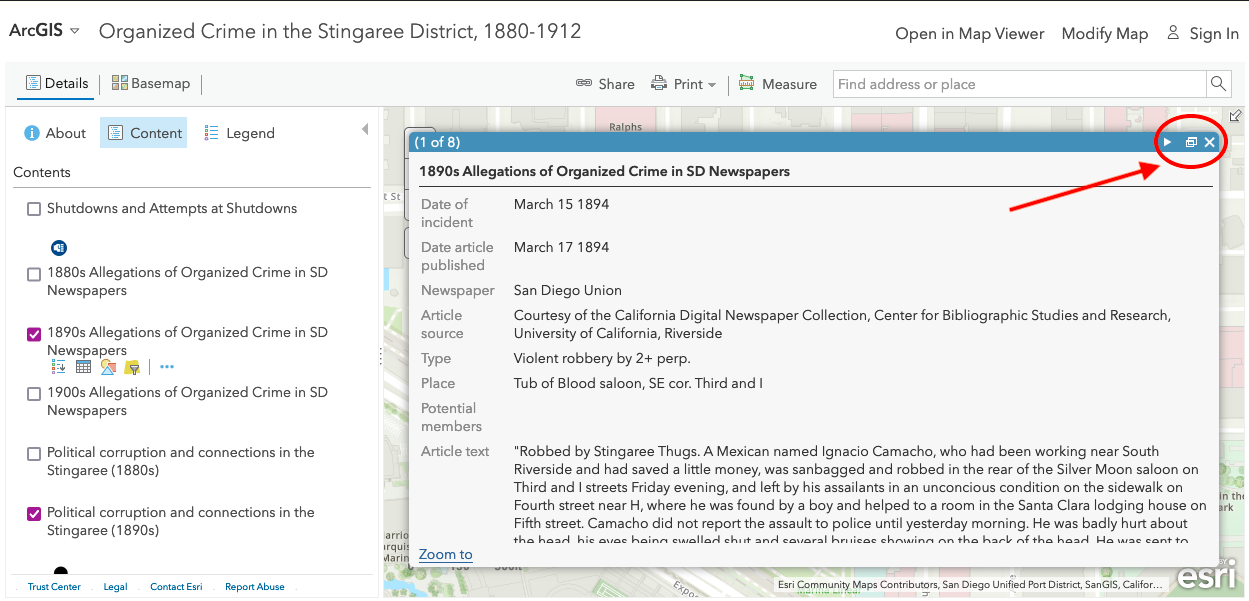
How to use this map
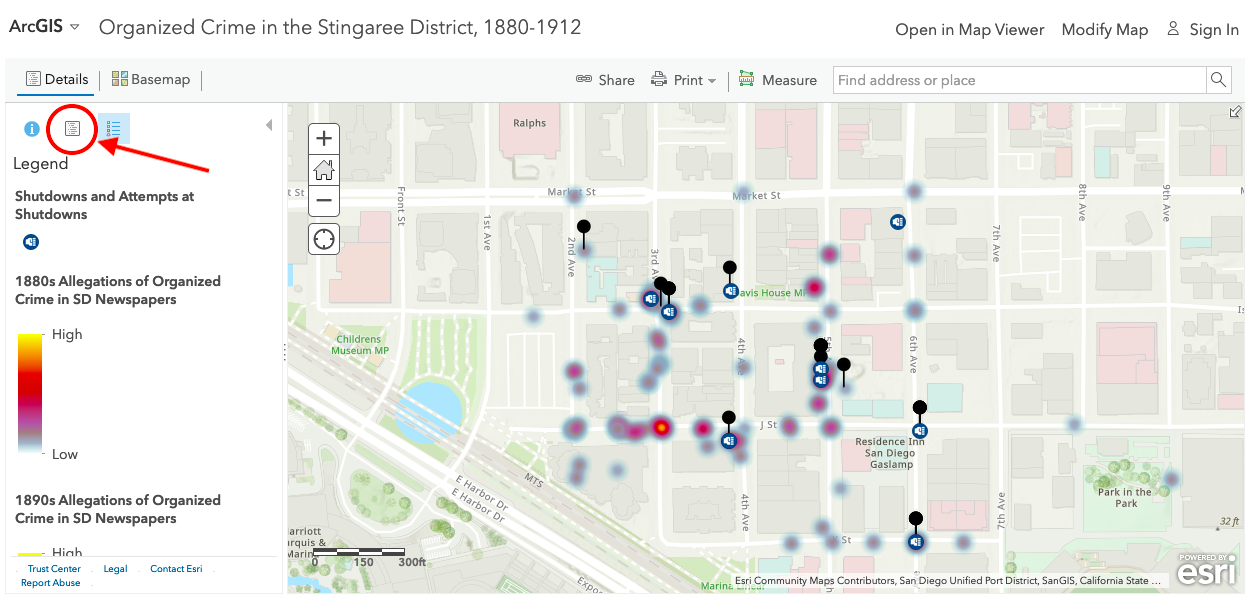
Under where it says “Details” under the ArcGIS logo, click the symbol that looks like the chart (on the right side of the “info” button)
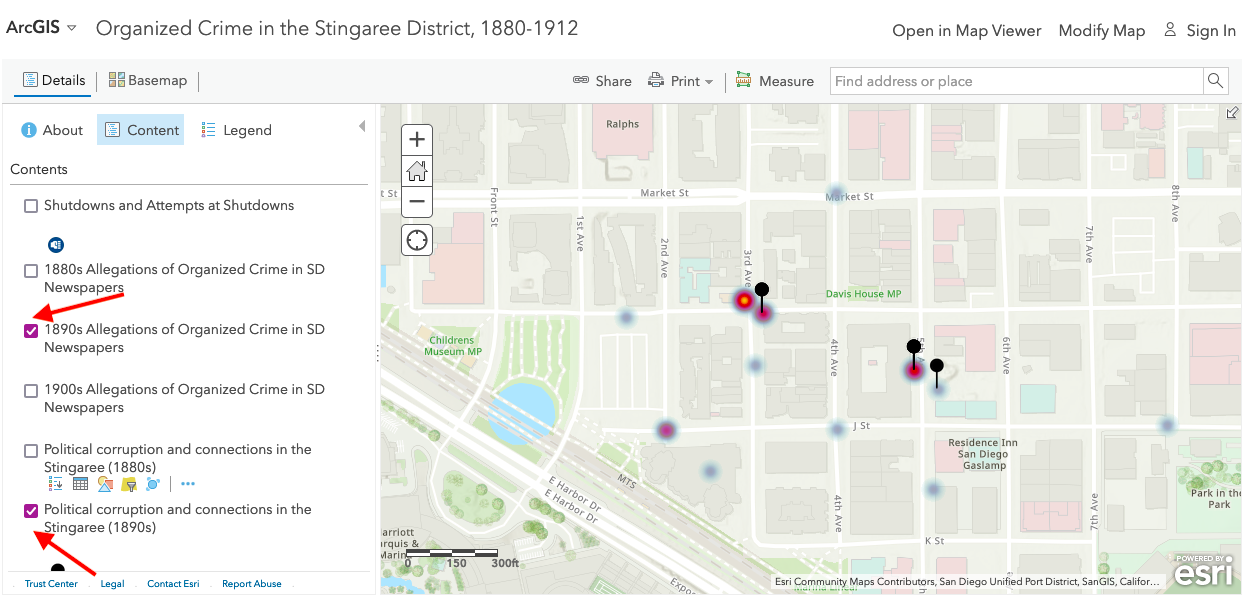
Next, go ahead and select the relevant layers for the decade you want to view. Decades shown are 1880-1889, 1890-1899, 1900-1912.
From there, you can click on any point on the map and use the arrows at the top of the pop-up to scroll through the relevant material for that address.
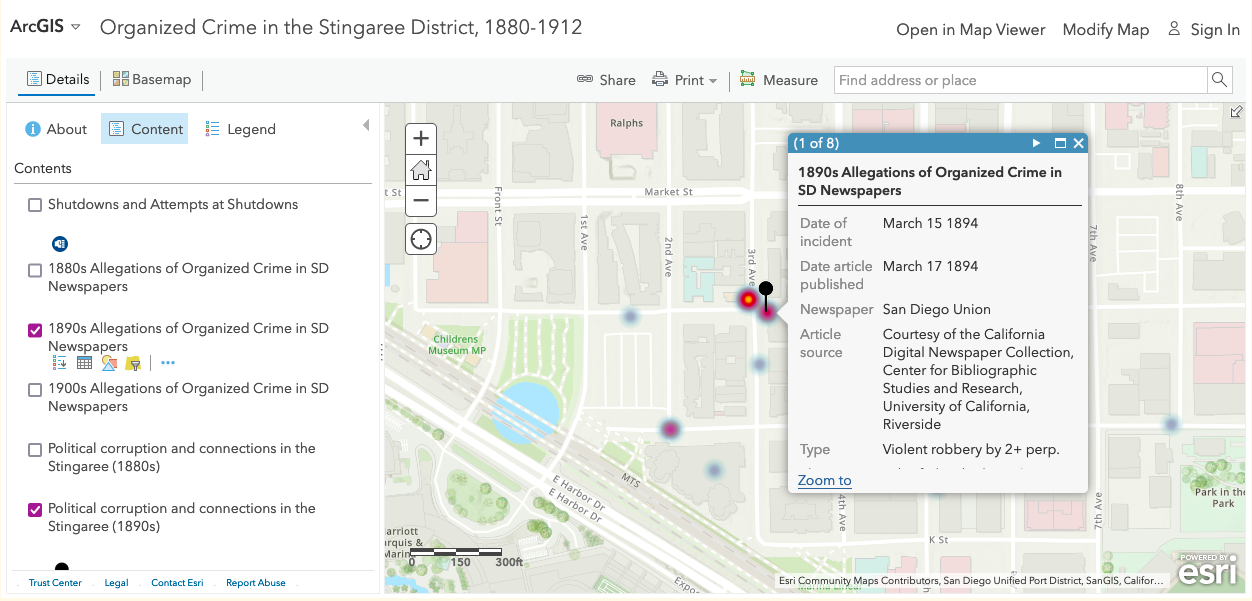
Use the window symbol next to the arrow on the pop-ups to toggle in and out of the full-screen view