Tableau
Posts
I’ve been collecting data for a while now, and it’s gotten to the point where I need to be able to visualize it in a contextual space in order to make any sense of it + identify patterns. So, when I heard about Tableau, I was really excited to give it a try! I was really intrigued by the promise of being able to map out all these data points.
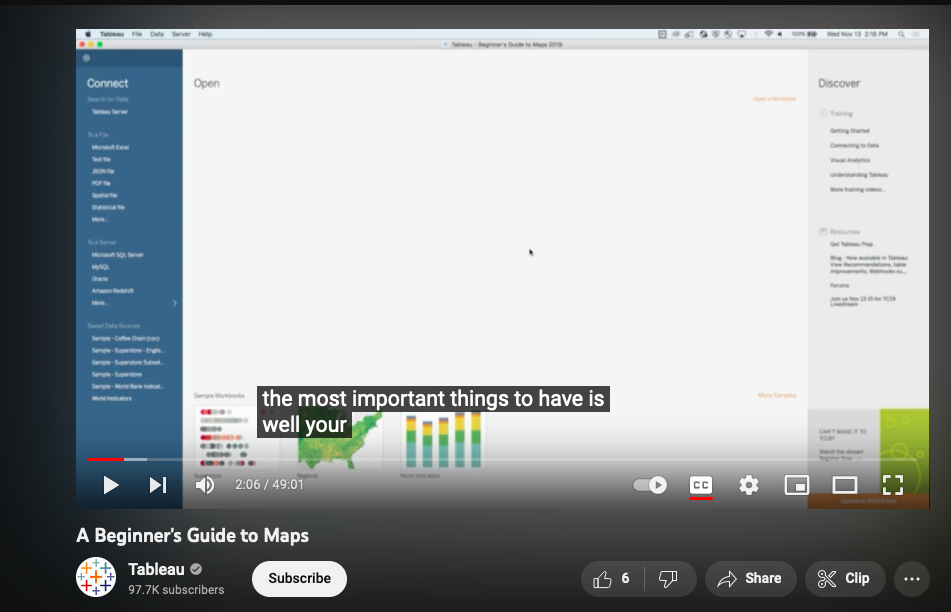
Once you’ve downloaded the free version of Tableau (and registered within the application, using the “xxxx-xxxx-xxxx-xxxx” code you got after registering as a student), go ahead and watch Tableau’s tutorial video on Youtube- A Beginner’s Guide to Maps
And here’s where I had my first problem (yes, while watching the video)– I have used Excel and Google Sheets, but only in the capacity of editing the values within cells. So, since that seems like a pretty foundational requirement for using Tableau, I had to take a moment to really learn how tables function within spreadsheets. I would recommend doing this before continuing, using one of the multiple helpful tutorials that are available (I used several and hopped around between them, but what seemed to help me the most was just googling the specific questions I had).
Next, return to the tutorial.
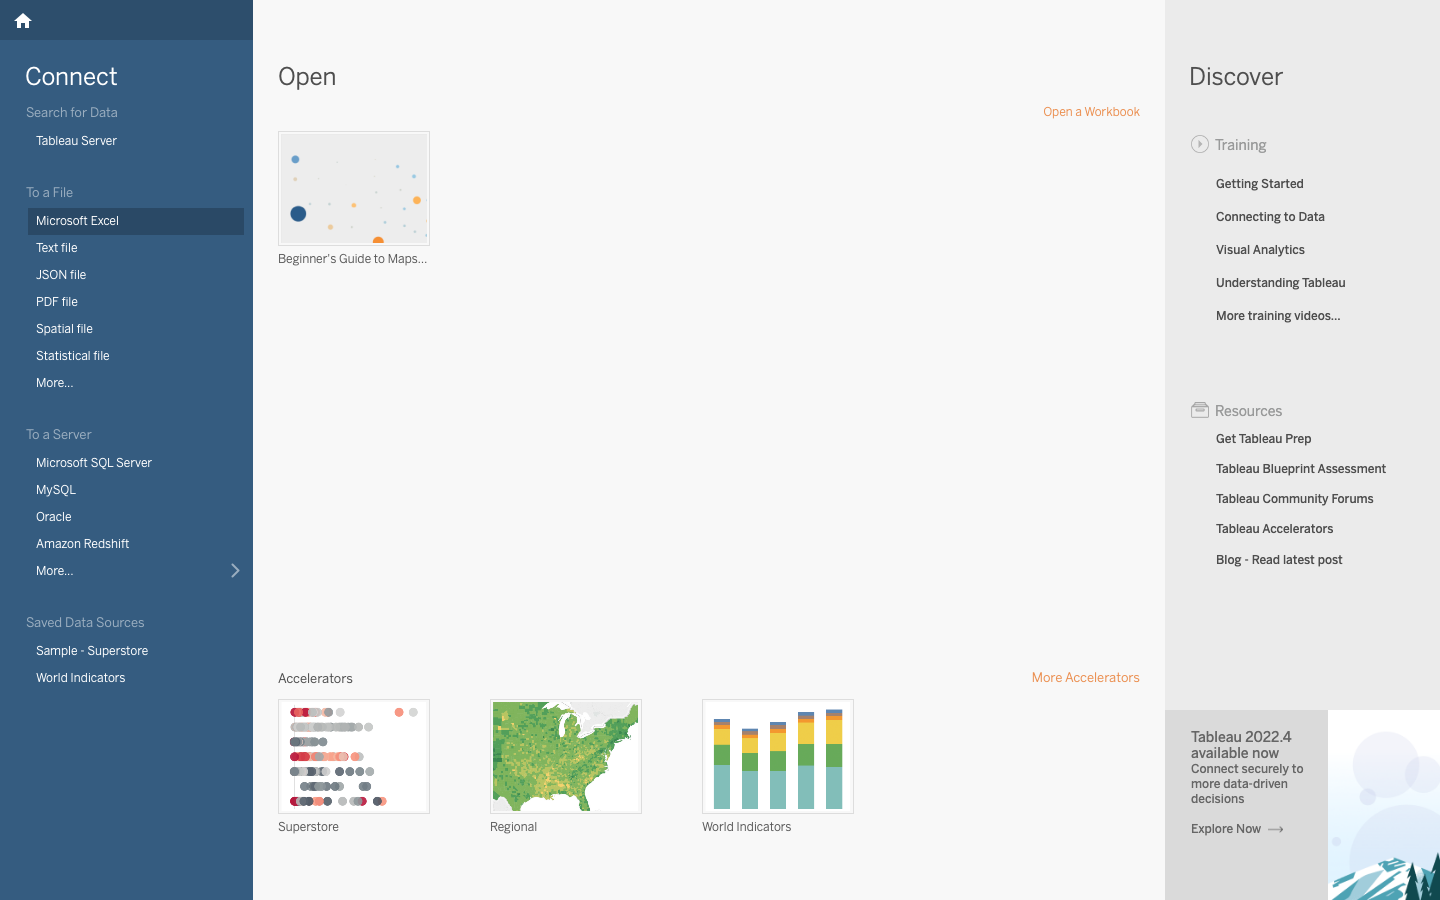
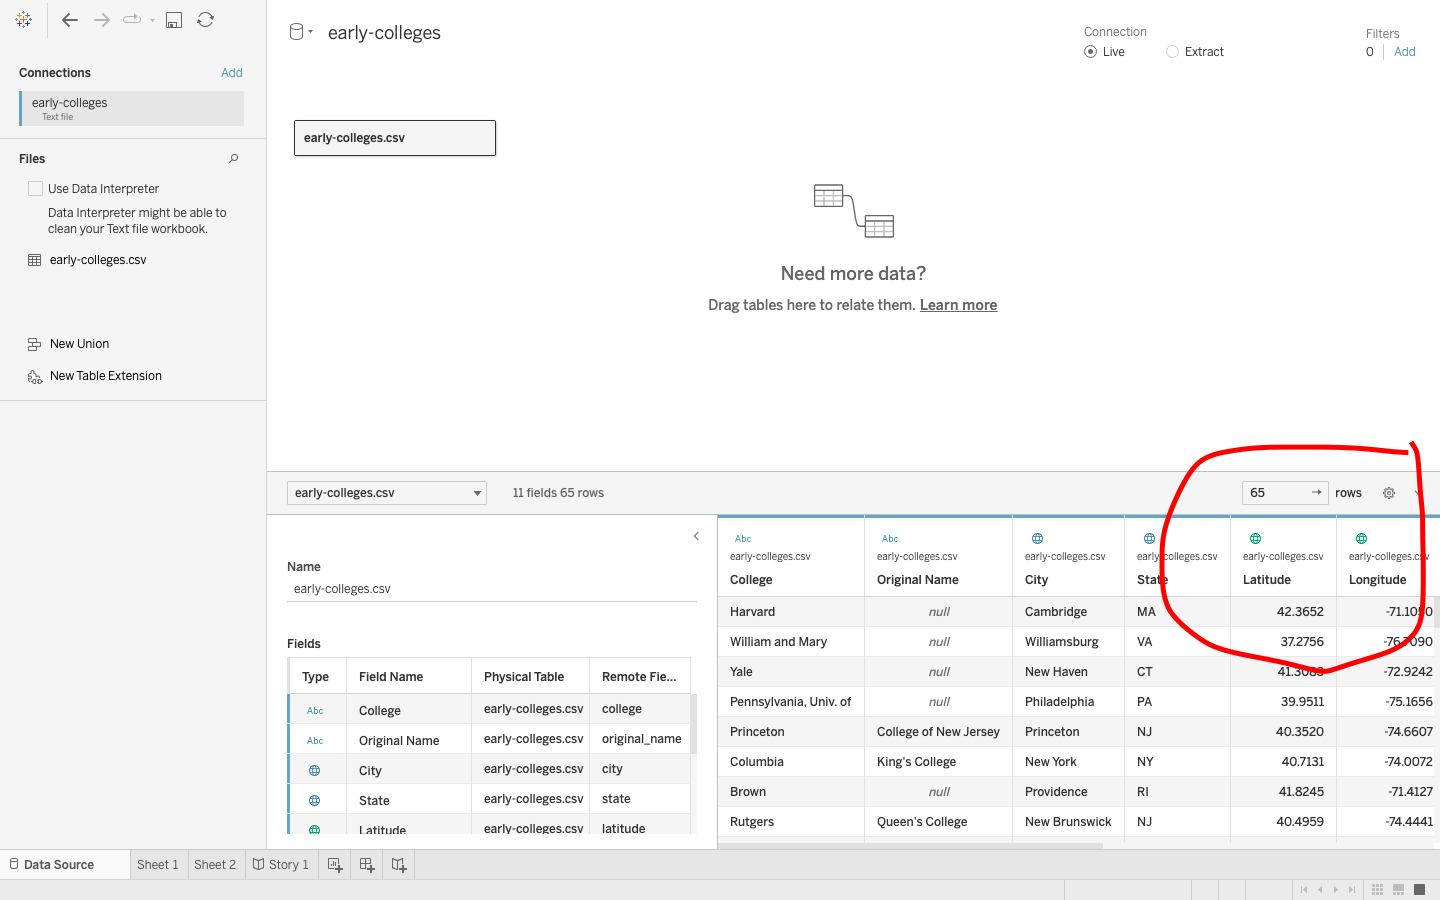
Follow along using the samples on the Tableau desktop application. When you’ve finished clicking through them, open a new project (be sure you use the navigation bar to open a new project, separate from the “A Beginner’s Guide”) and import the “Early Colleges” dataset (it came through as a text file on my Mac).
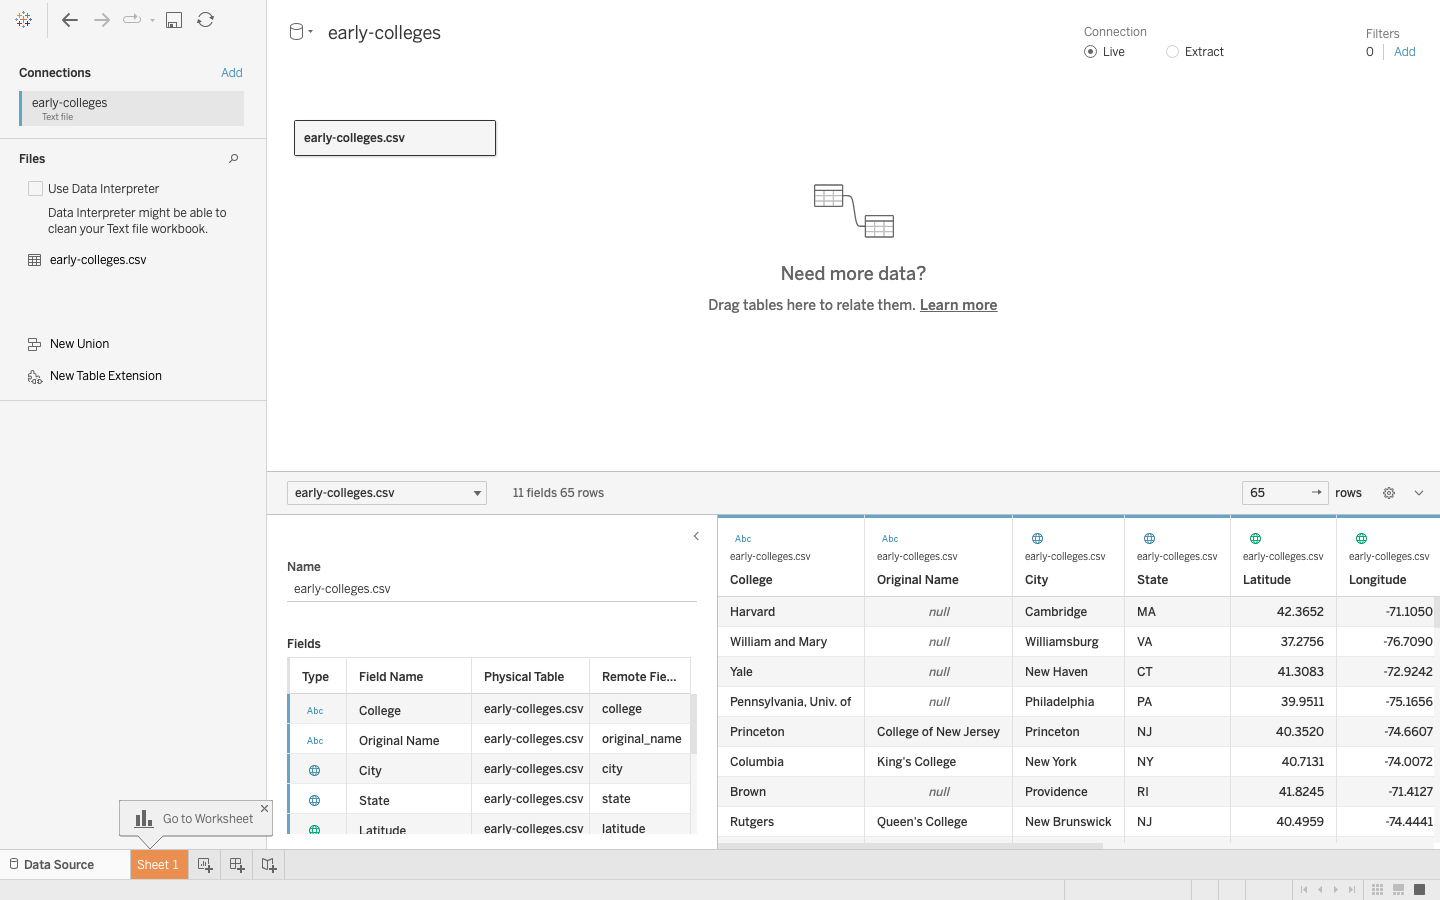
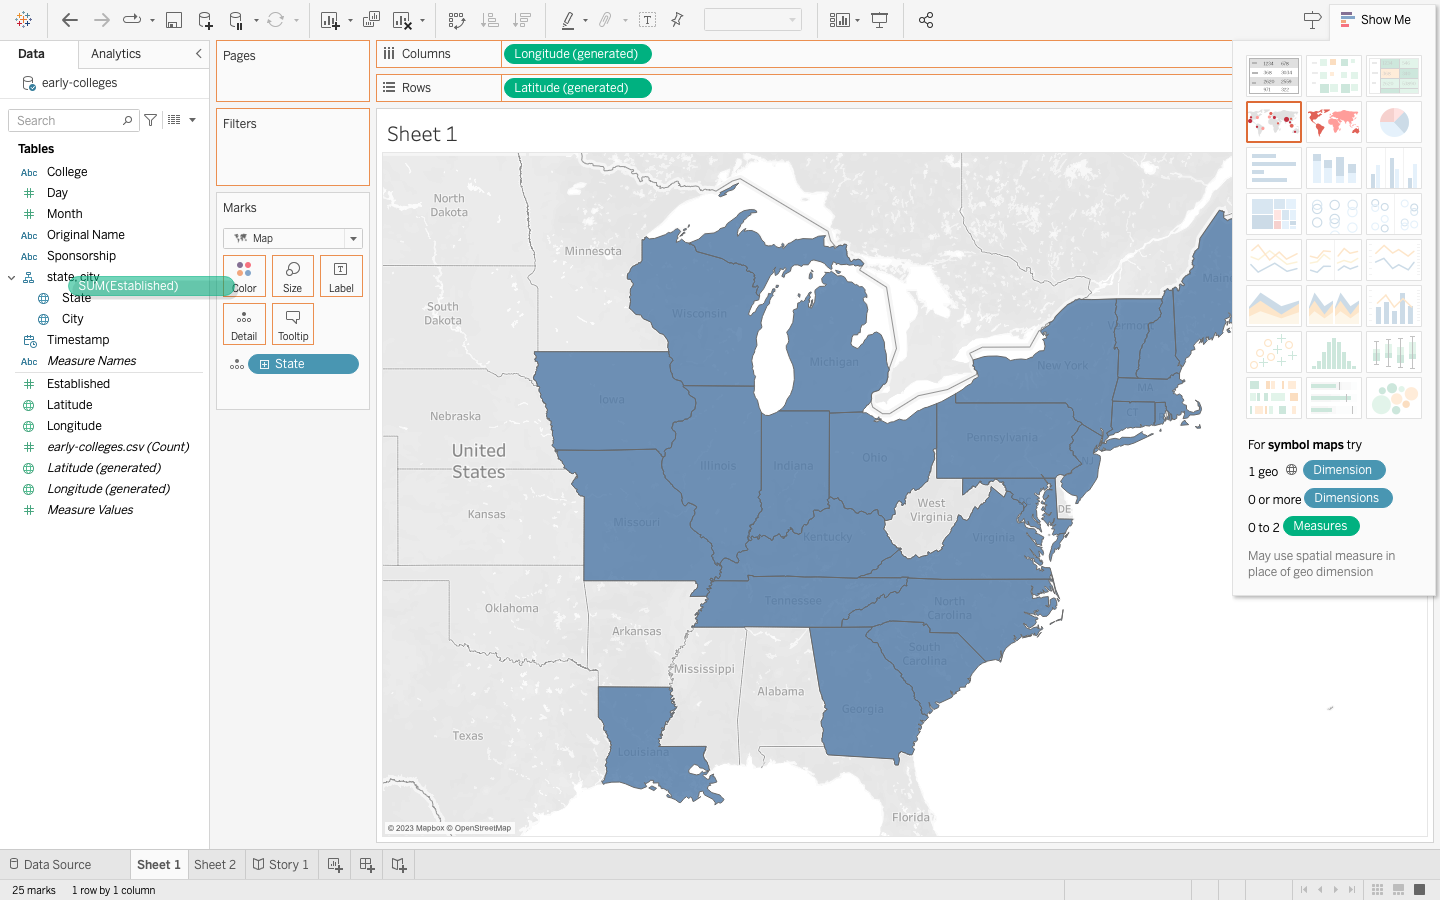
Your screen should look something like this, with the bottom bar having three options for creating something using your data set. Go ahead and select a new sheet, clicking on “State” on the sidebar (which will allow you to select one of the two map options on the right).
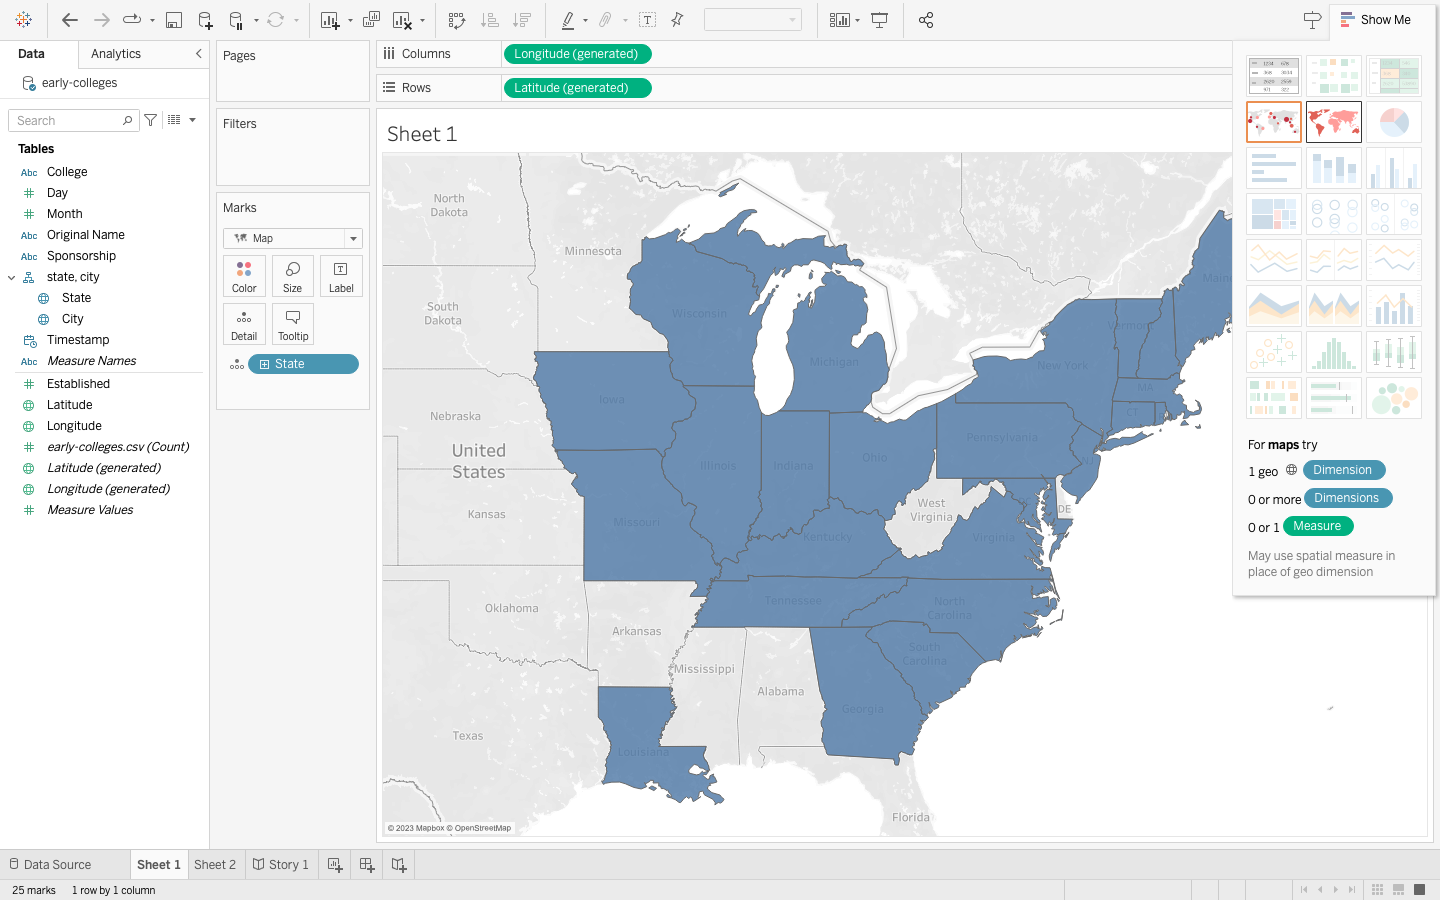
Next, drag the “Established” category from the left hand side to the color-coder thingy.
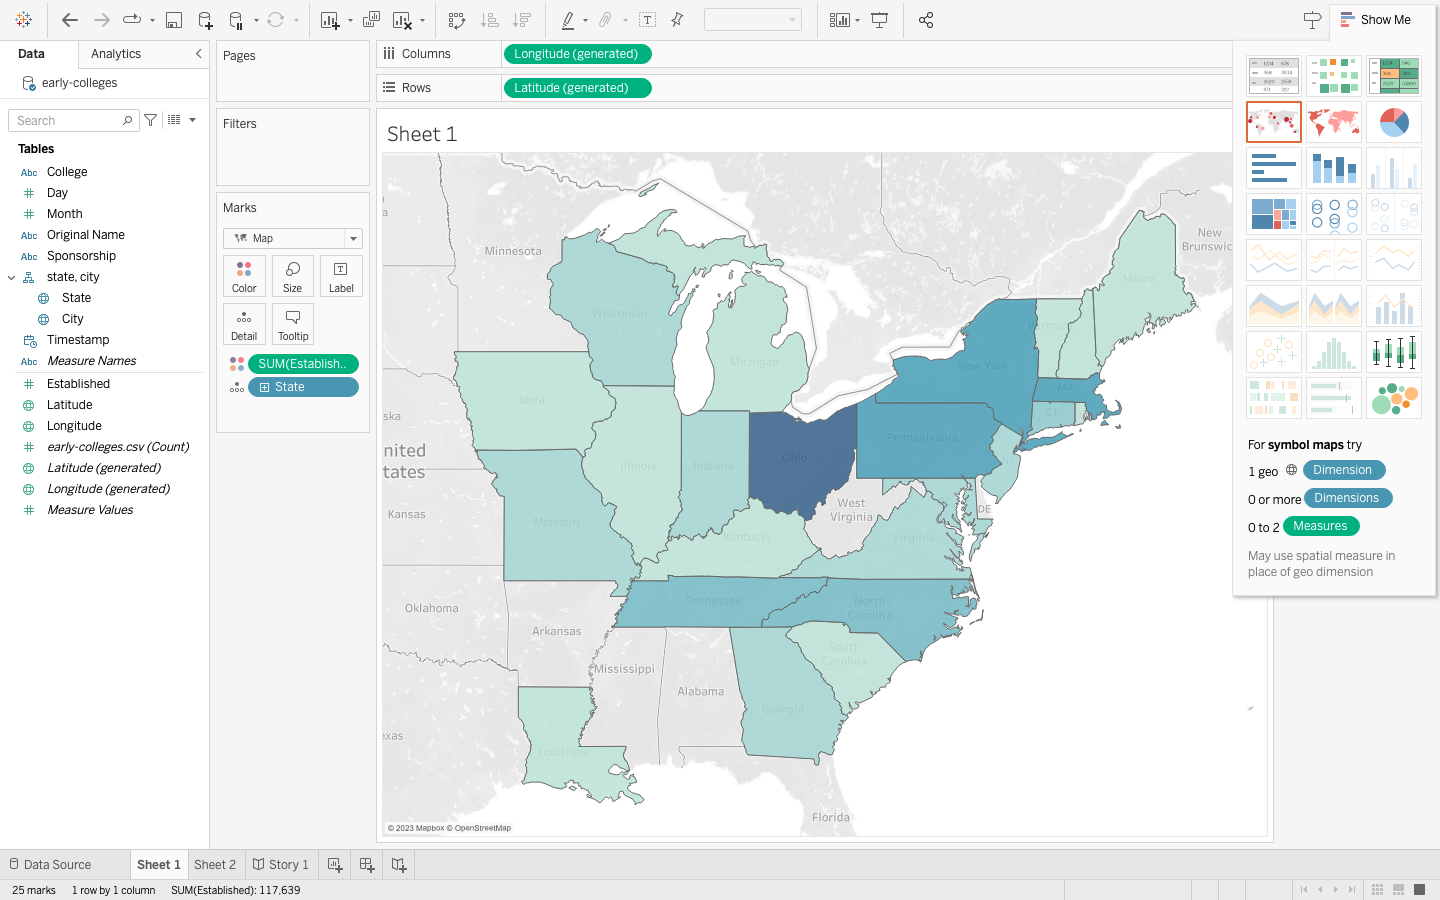
Now, it should look like this.
Yay!
Now we can play around with our own data sets. Using Excel, create a table and add in your data. I used data from the 1900 census, which I accessed using Ancestry.com (Their search engine searches through census records, making it a million times easier to navigate compared to scrolling through the bulk census scans. You can either pay for it or access it virtually using your library card).
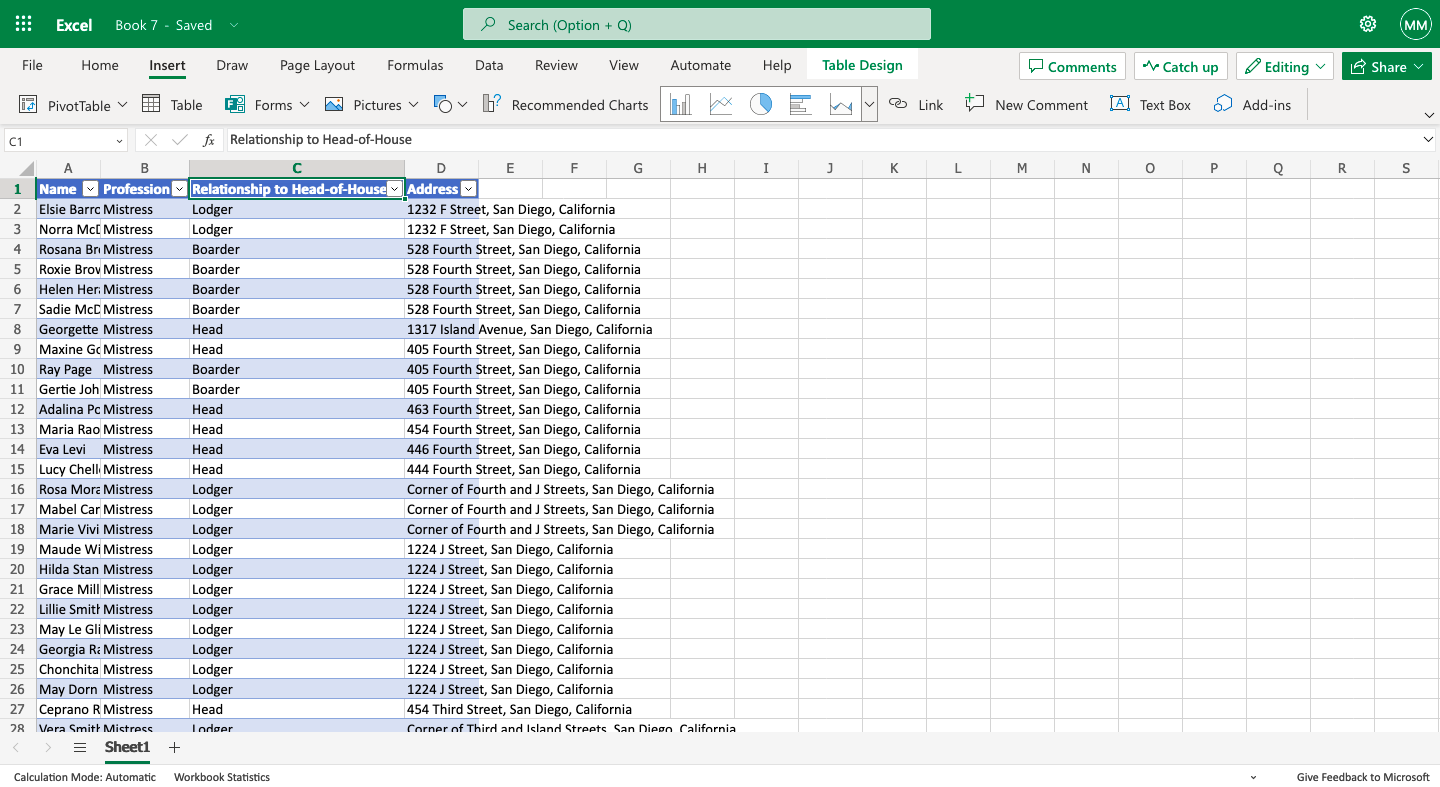
Then, go ahead and download the Excel file, dragging it straight into the new, blank project you’ve created on Tableau
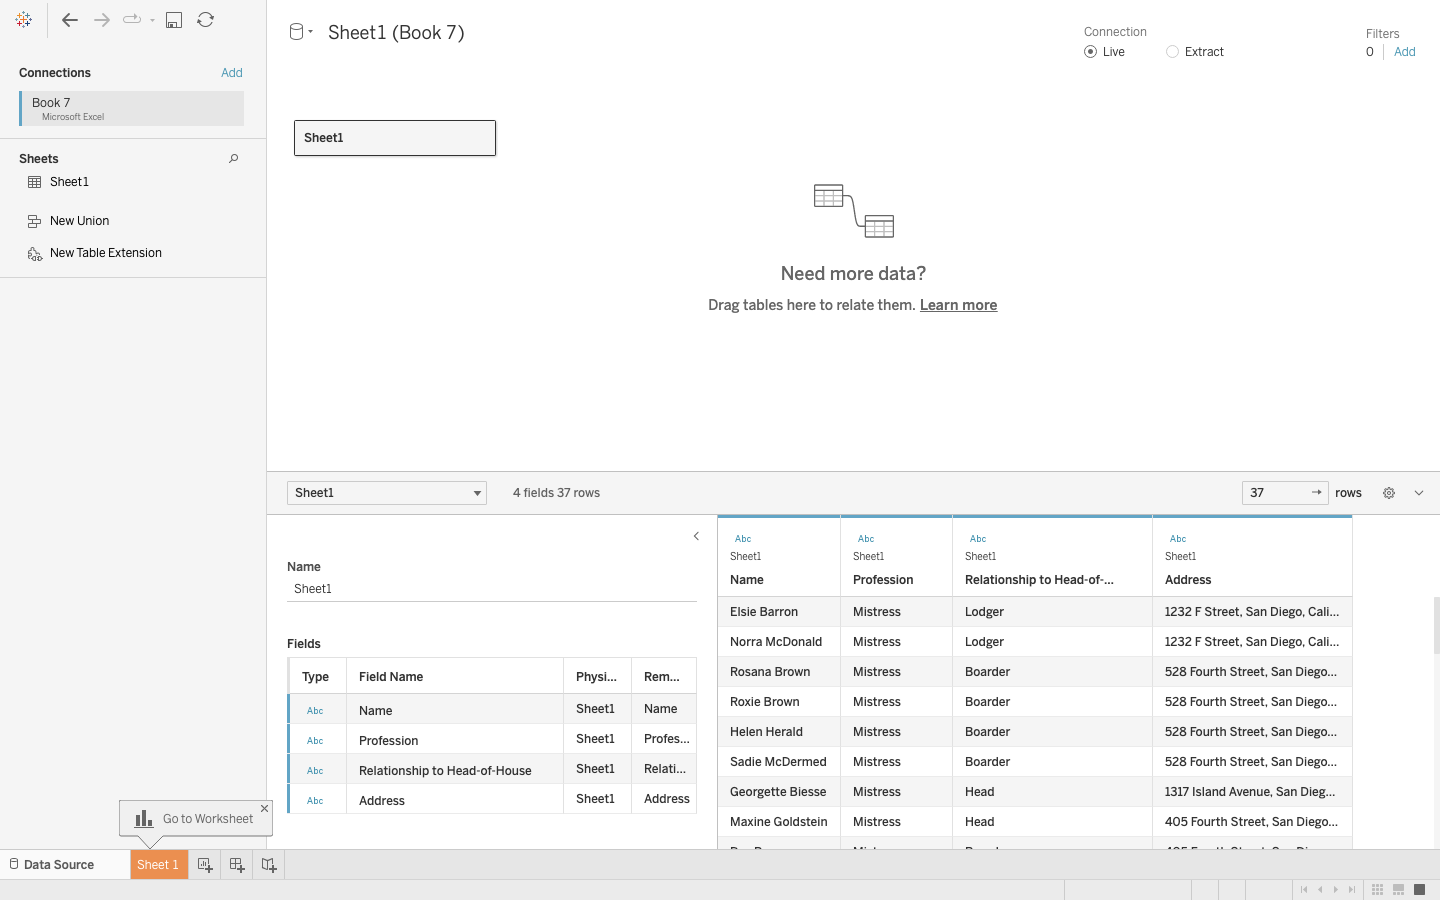
Oh… wait…
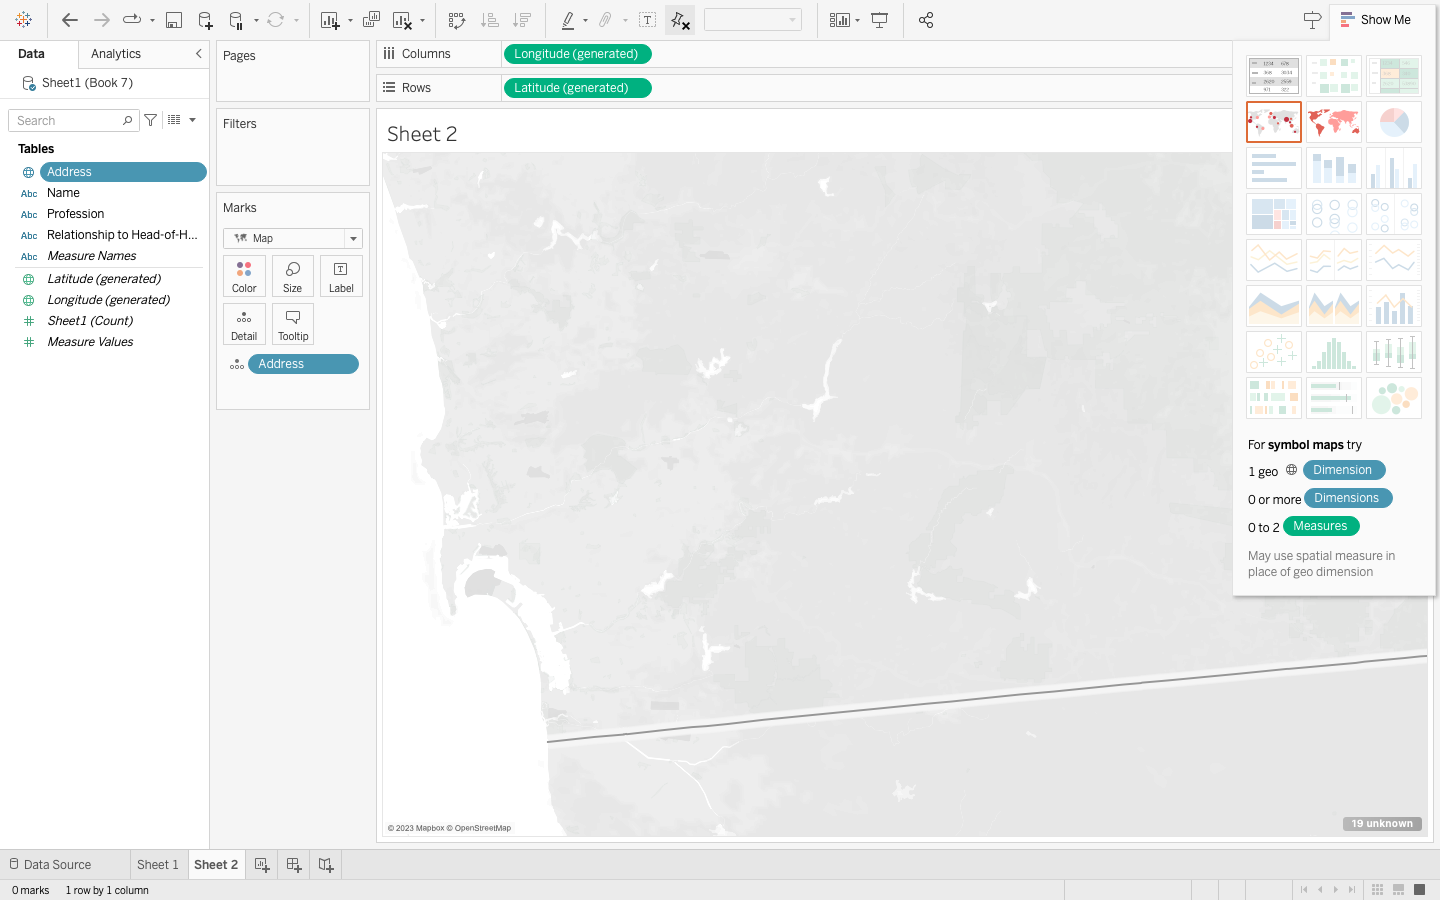
I was worried this would be a problem. Many of my locations are fairly unspecific, as I used street addresses. Let’s try again with the actual coordinates, using the early colleges map as a reference (see here how the locations are listed in Lat/Long coordinate form?)
So, if you’re working with addresses, try using a Latitude/Longitude Generator. I used this one here: GPS Coordinates.
Still, it took me a few hours to figure out that the “Tables” on the left hand menu would make up each data point on the map. The Latitude and Longitude I had entered (not the one that says “generated” next to it) needed to be dragged up to the “Tables” (here I’ve placed it under the hierarchy named “City, Address”)
Then, I went up to the “Map” tab in the navigation bar, selecting “satellite”
After signing up for Tableau public in order to embed the interactive map into this blogpost, I realized that I would have to export the entire thing from the Tableau desktop app, which my computer didn’t want me to do for some reason. So, I did it all again in the Tableau public app, which appears to be almost identical (except for the fact that it will be available online).
Here it is, after selecting “Upload to Tableau Public”. Take the embedded code and add it to your post. Make sure you are editing under the “Text” tab and not the “Visual” tab.
What did I learn? To be patient and stop jumping ahead. In hindsight, the moment I got to the point where the data I plugged in with the Early College list made a map and I just got to making my own without trying to create a hierarchy and labels. I’m excited to play around with the technology, though, and I look forward to learning how to use the software at a more proficient level!