Hello All! And welcome to the tutorial on interacting and navigation with Tableau!
As a bit of a forewarning, I need to let you know that learning some of the basic tasks of this website even with the support video will take you anywhere from 1.5 to 3 hours. It really just depends on you. So don’t worry about it too much!
Now, onto the things that you actually need to do. First and foremost: Get a second screen to view this tutorial on map making with Tableau by Ashwin Kumar. If you’ve got a tablet, smartphone, any form of dual monitor, etc., you are going to need it to make this process easier. From that point, the video is going to walk you through some basic information for 4 different maps.
As a reminder, the actual information is going to feel like a lot, but that’s what Kumar’s video is for. To help you as it helped me! I would also recommend bookmarking that link, you are going to definitely be friends with it.
Onto the actual tutorial… It’s very straightforward. Complex, but straightforward once you understand what exactly you’re attempting to work with.
The first thing you’ll need to do is open you Tableau Desktop you’ve downloaded (and if you haven’t make sure you go download the student version of Tableau here). Your Tableau Desktop should look something like this
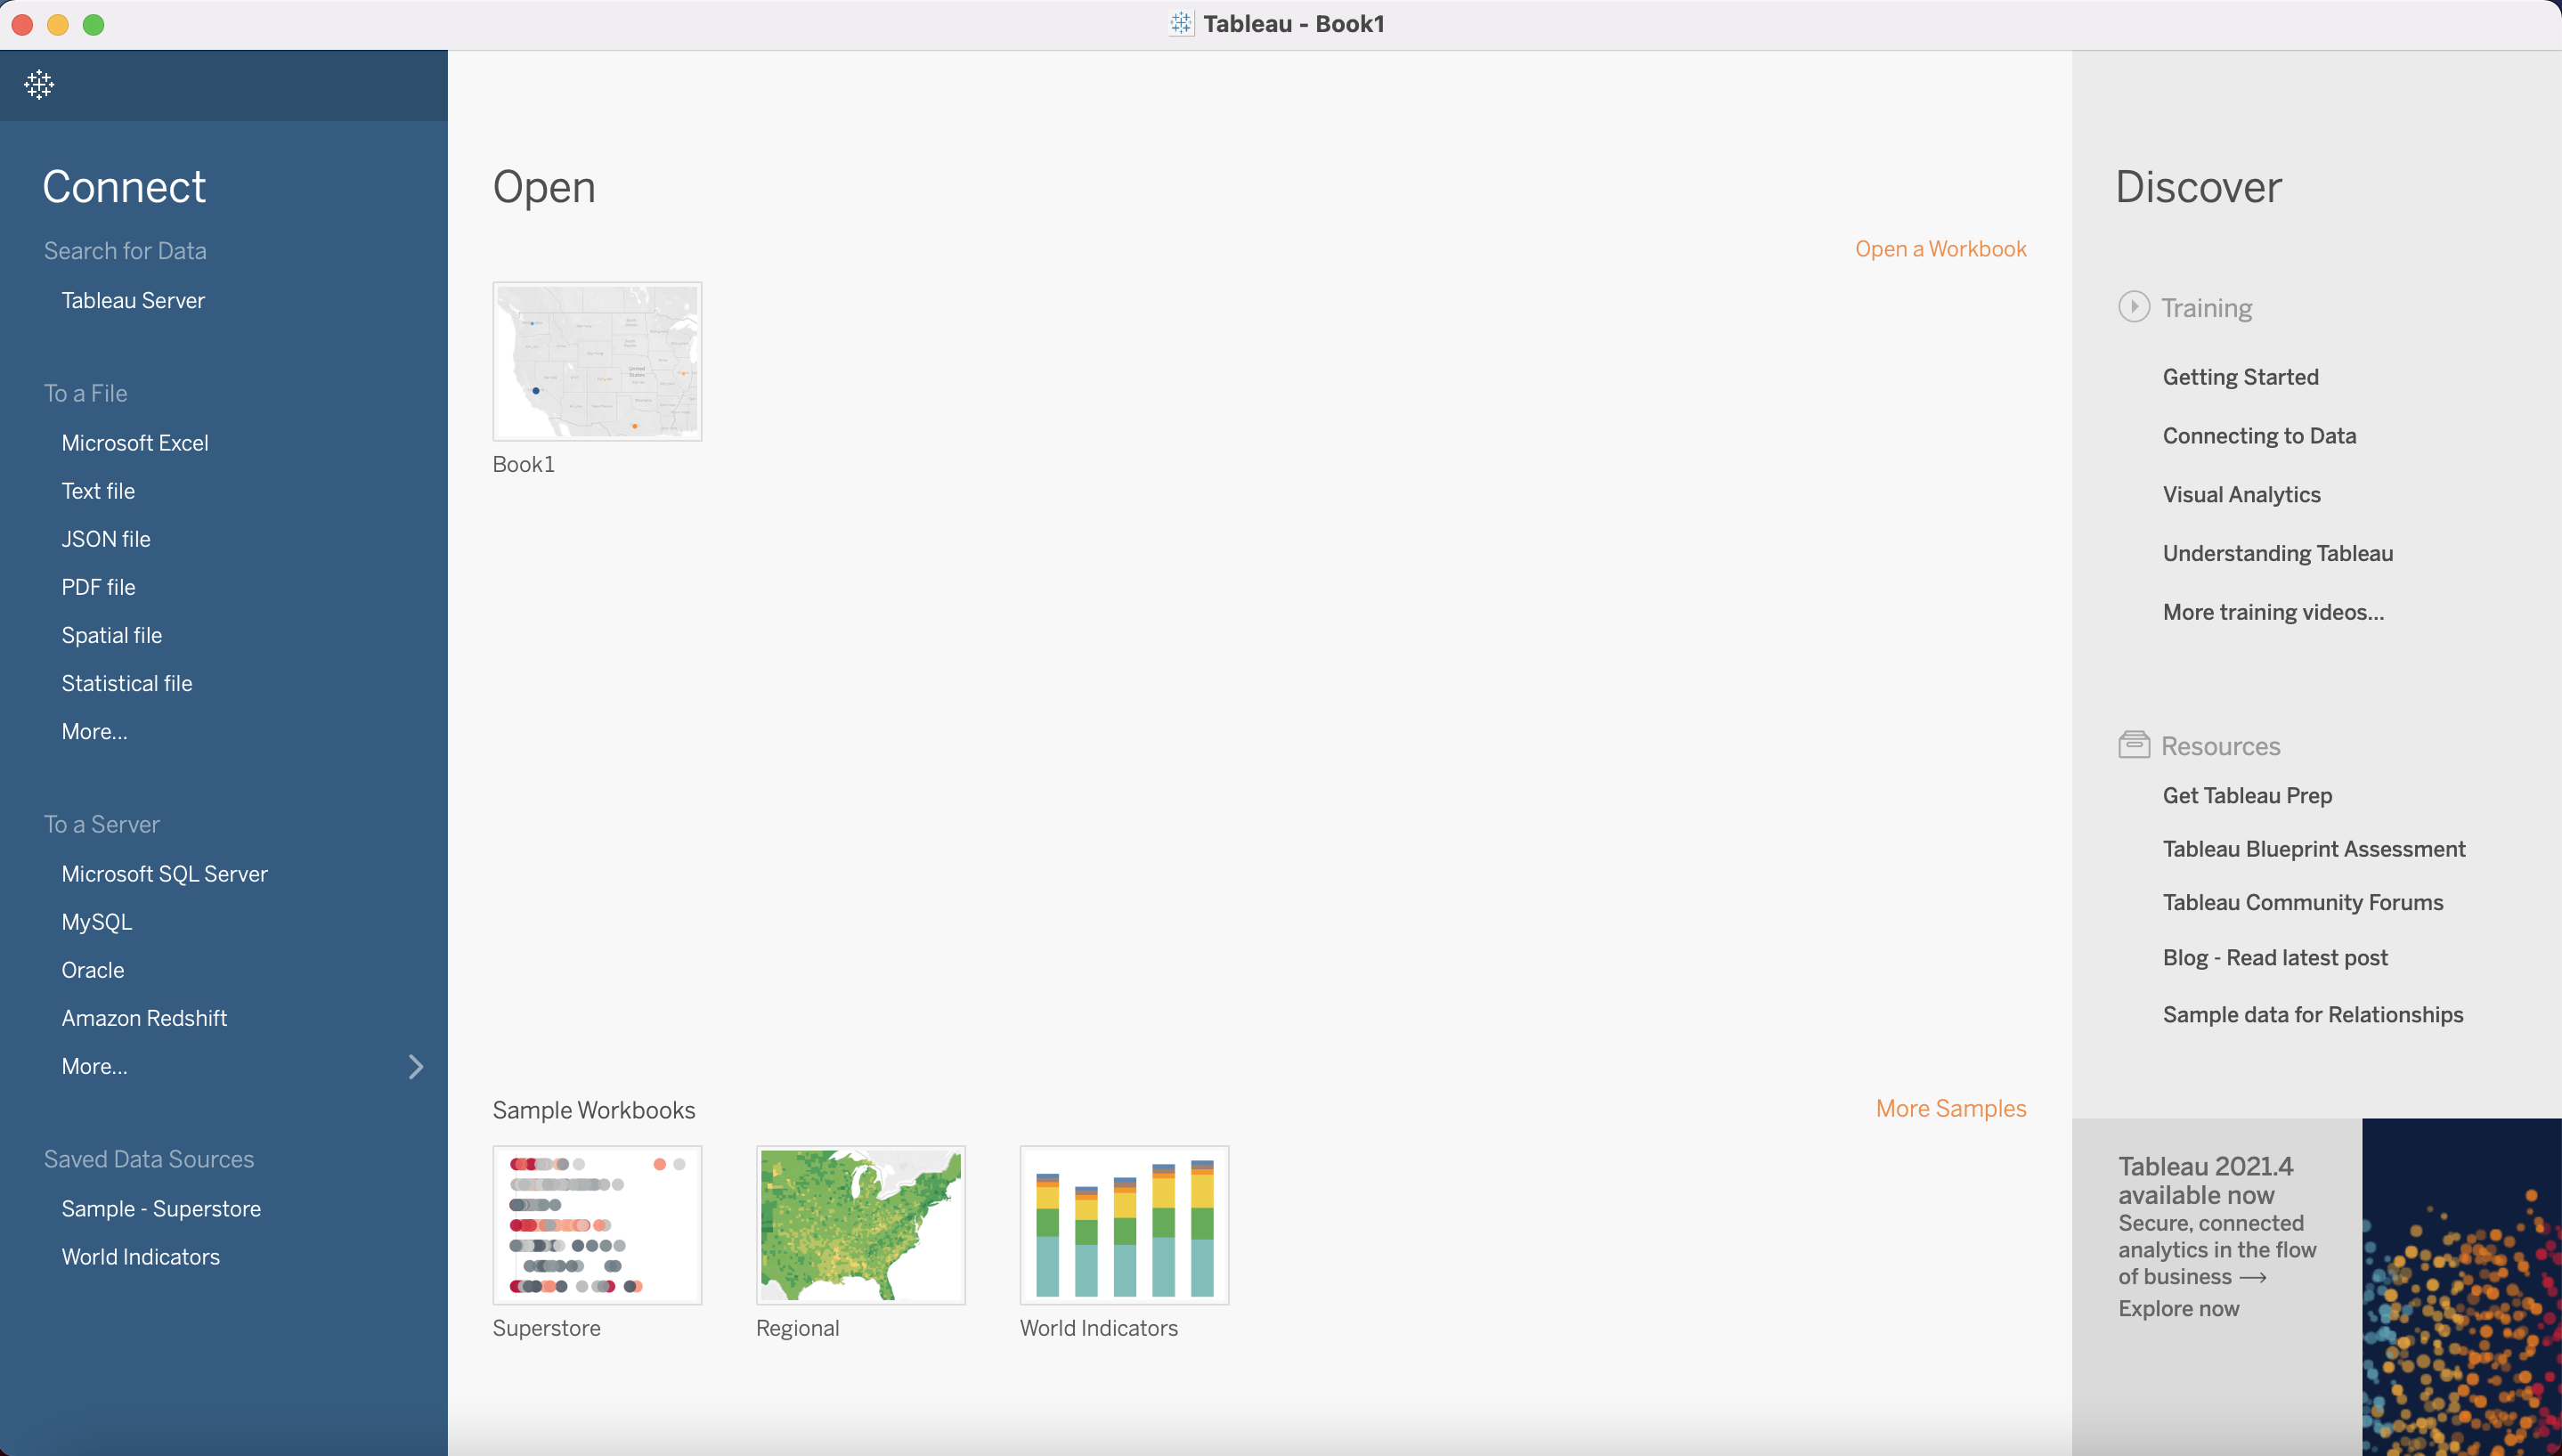
The next thing that you’ll need is files. For the purpose of the Tutorial video, you are provided with files to download. These files will contain zips, Microsoft Excel, and Images.
For the start of these tutorials, you’re going to open one of the Excel files by clicking on Microsoft Excel. This is going to take you to your zip folder full of your files. Please keep in mind that this process is going to be repeated a lot. Excel files are going to be your best friend whether you want them to or not. Once that file opens, you’re going to be taken to a blank page. That blank page is going to change when you add the Excel file to this
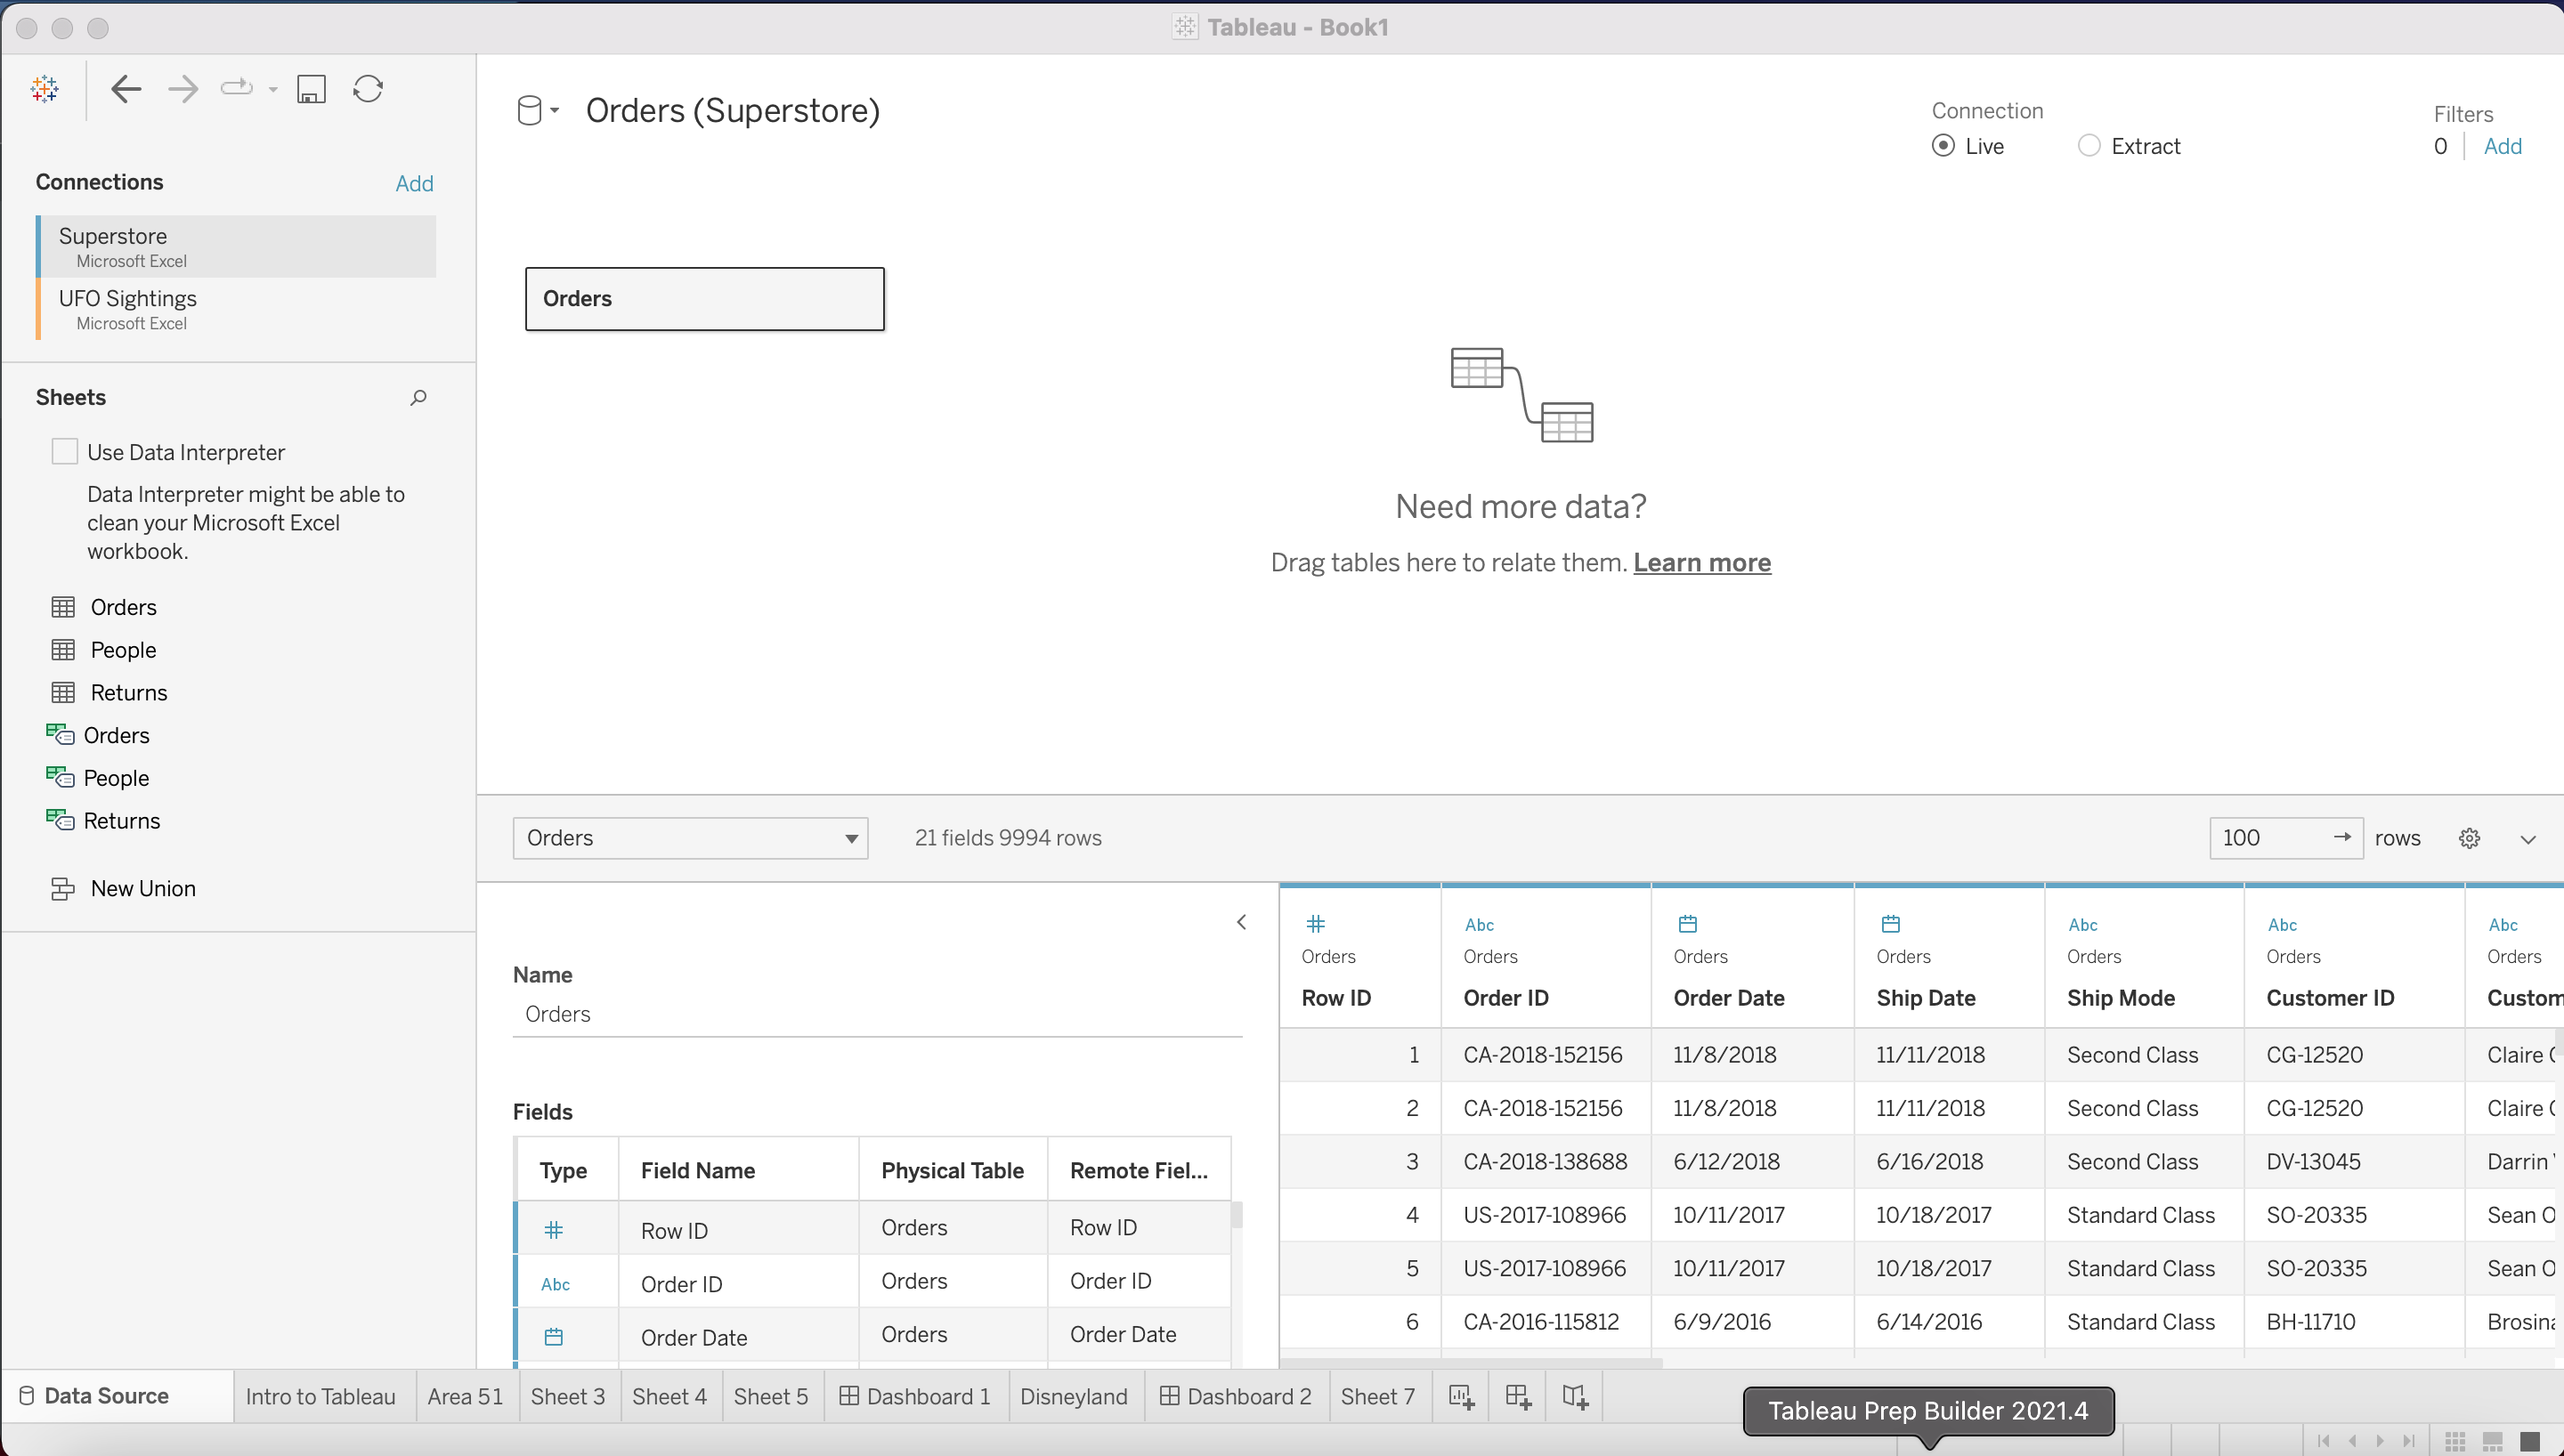
At the bottom of the screen after sheet 7, there are three little boxes with + marks next to them. You’re going to click on the first + mark, and this will take you to a map page. The map page for this example will be under the Intro to Tableau tab I’ve already created
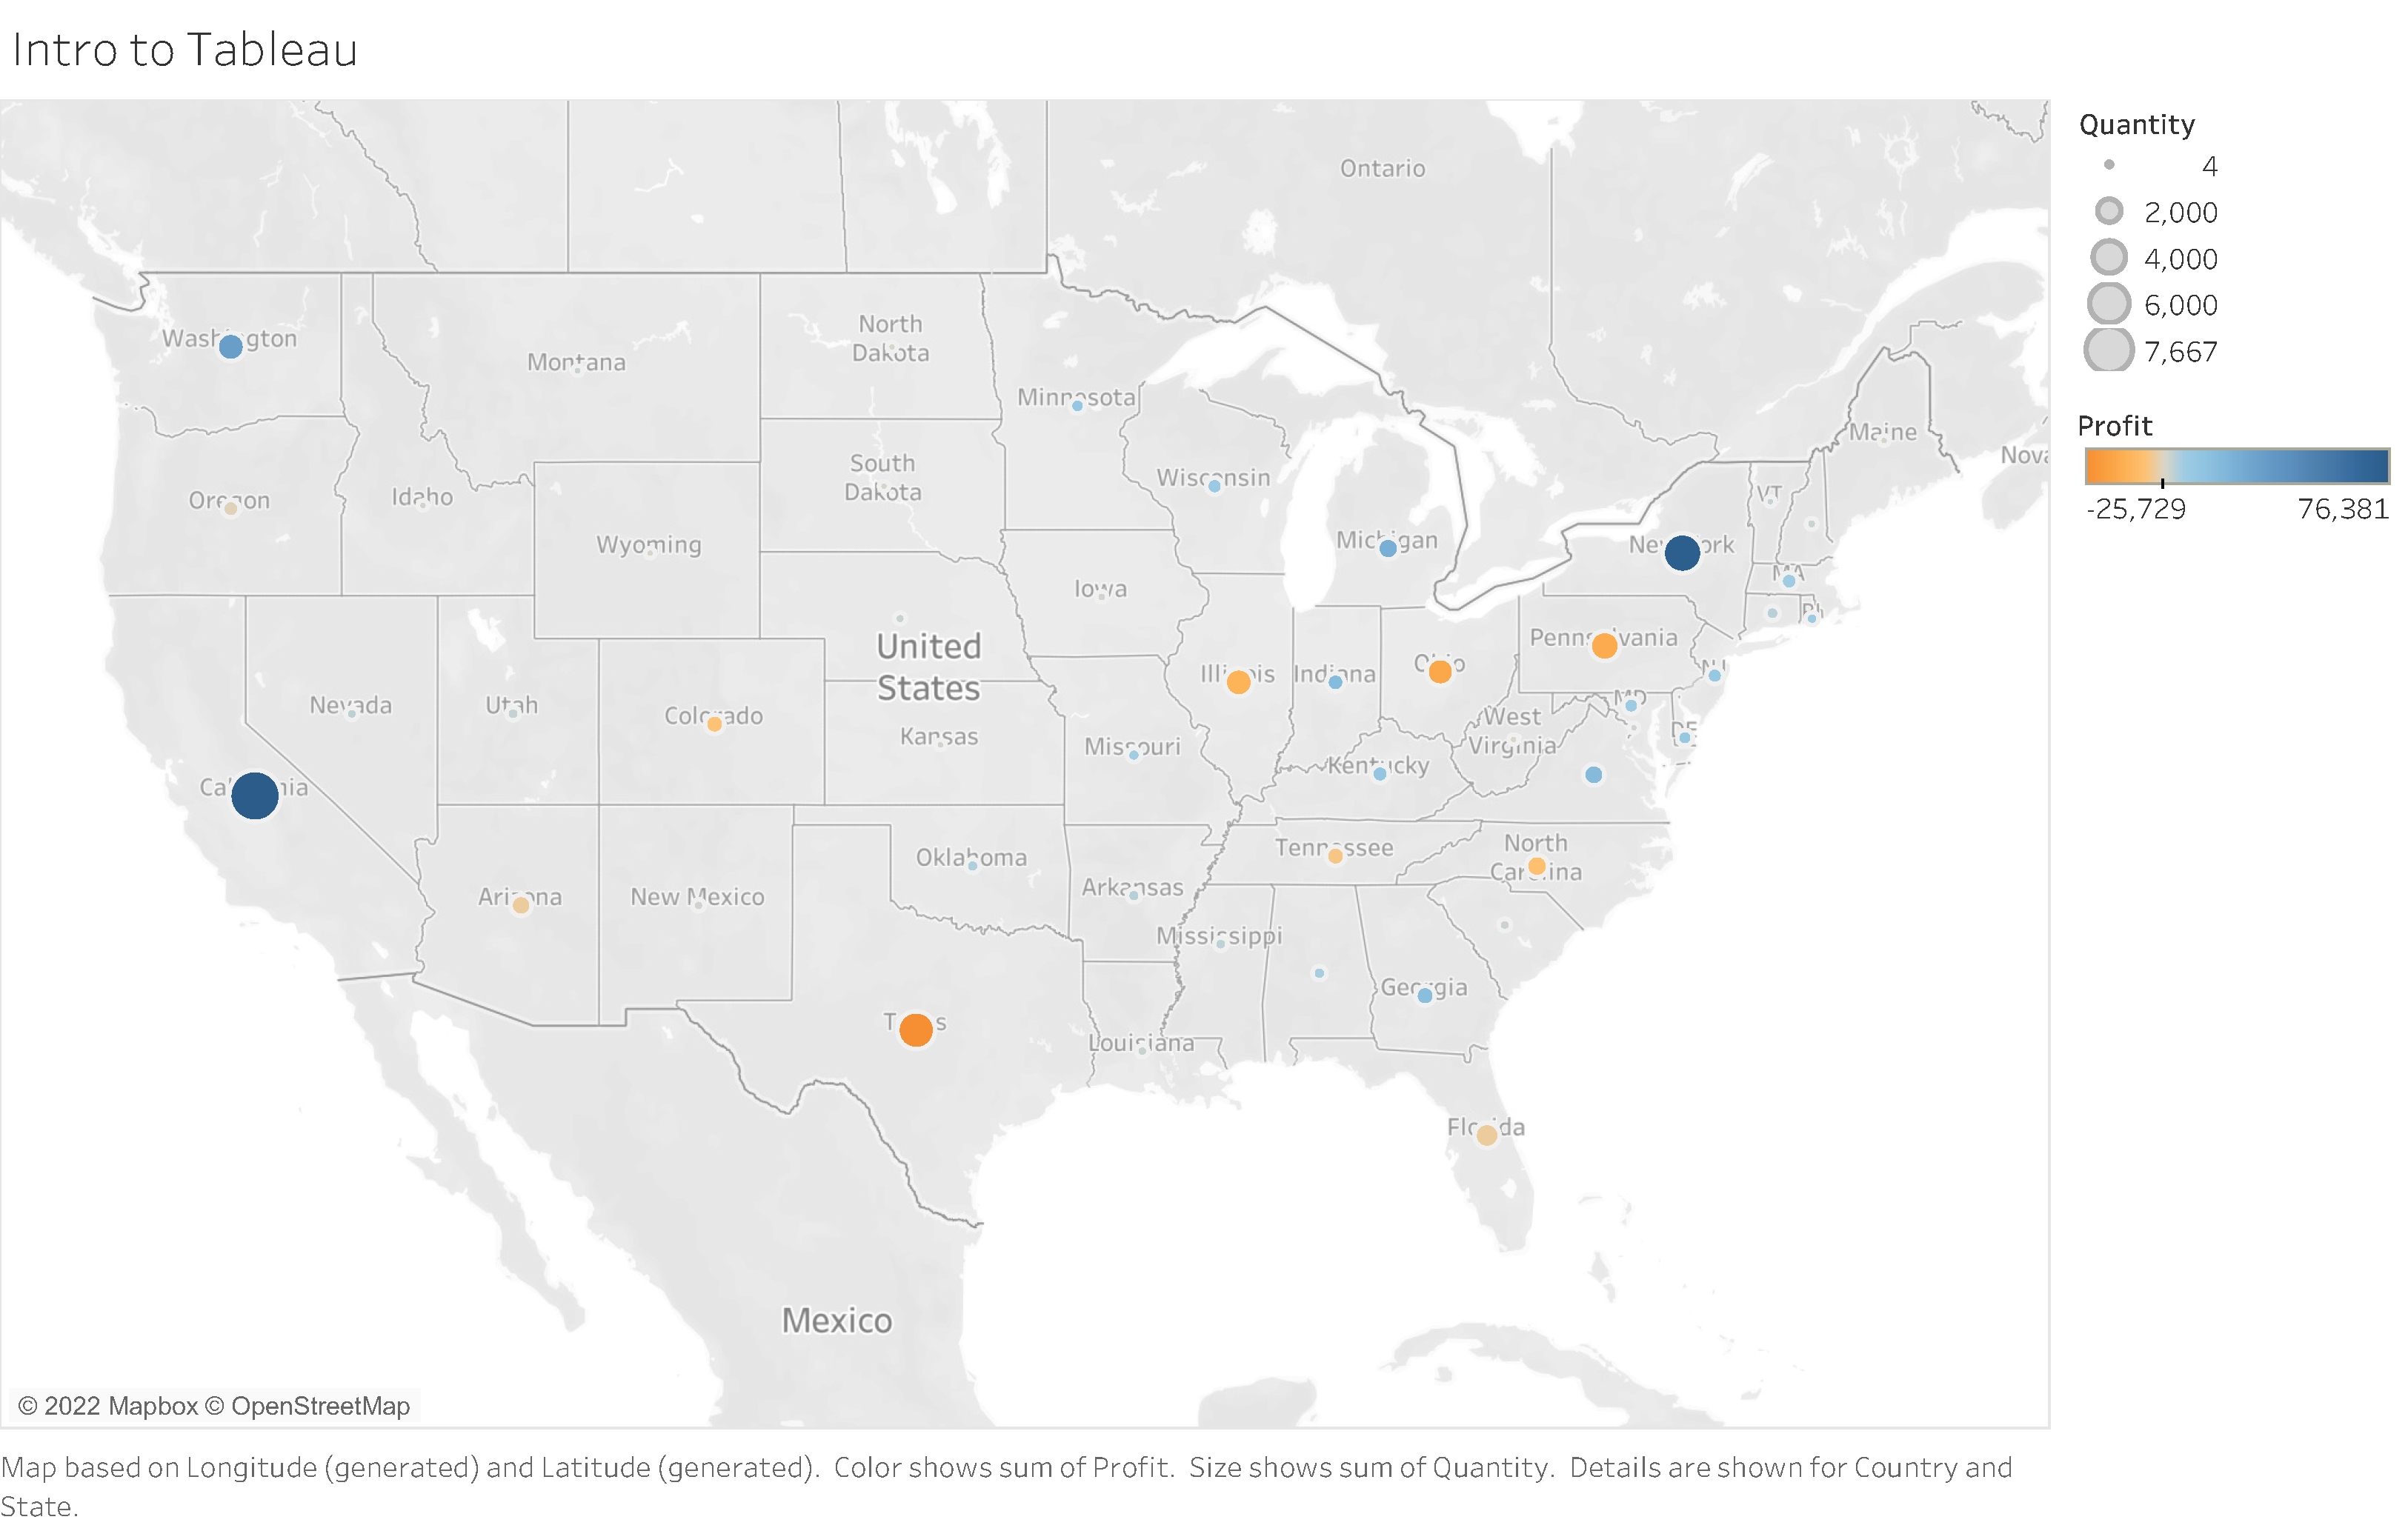
As you can see, my map is already completed. There’s good news for you yet here: There is no input of information at this stage, that’s all going to have been done beforehand in your Excel sheets. Tableau is going to handle that data configuration for you from here on out, so it’s your job to make your map look pretty!
Spoiler alert: you are going to be doing all the dragging and dropping of icons. Following the steps in Kumar’s video is going to tell you that you’ll be dragging the categories on the left to the right. As a heads up, if the category isn’t a solid block color when you hover over it, it WILL NOT DRAG. I did struggle with this a bit at the beginning. For this basic map, you’ll just drag the categories over for Country, Profit, and Quantity. To get the circles and the colors, you will drop the Quantity category in the size box under Marks, and Profit into the Color Box. There are a lot of fun gradients when you click on the color box after and click edit. Gaze upon your gradient of preference.
Map number two is a bit more complex than the first map.
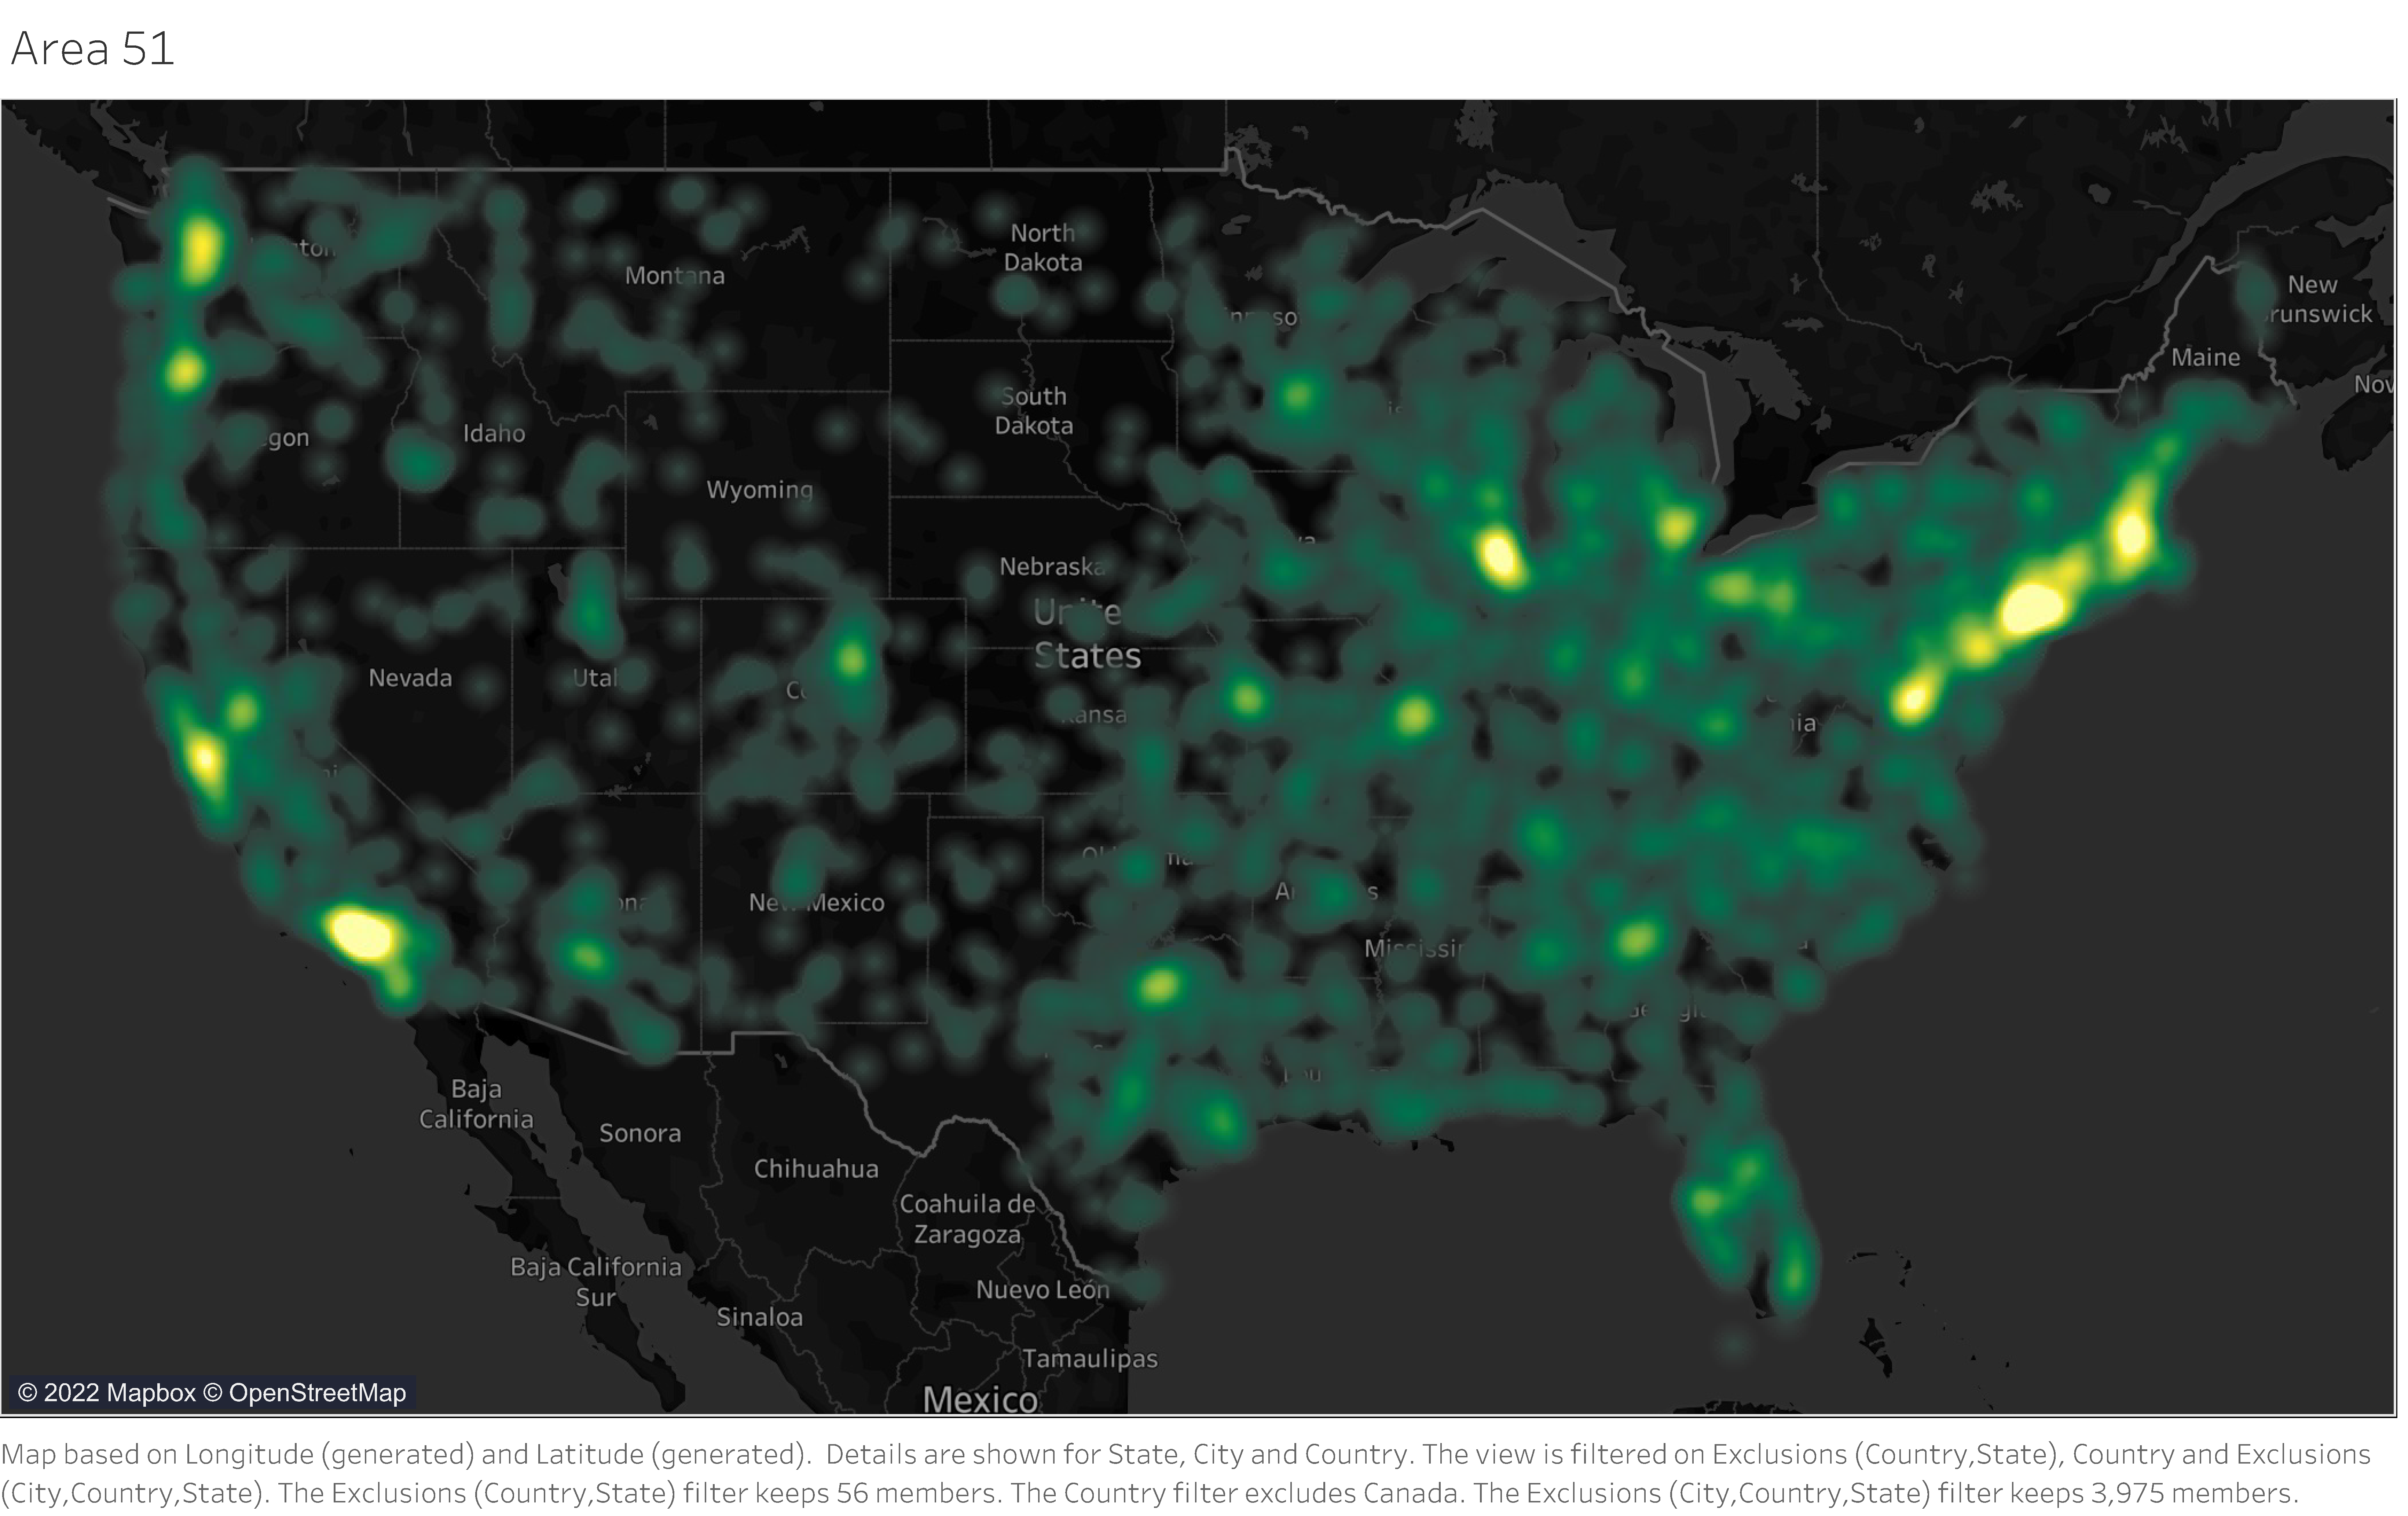
This map brings the spooky and aliens using Area 51 as a reference point. For this map, this is where we start looking at the heatmaps, hence why it’s green and blurry looking. For this map, after adding the excel sheet for UFO information, just state needed to be dragged into the Marks box under detail and tooltip. To get this neat effect, you just need to click on the box under Marks labeled detail, scroll down to the bottom and click the option for density. That’s all you gotta do! To get this dark background for your map, just scroll to the top of your screen where you have an option to click map, go to background maps, and scroll down till you see dark, then you click that! Now you have a spooky alien Map for Area 51. Super fun.
Map number 3 is where things get a little more complex.
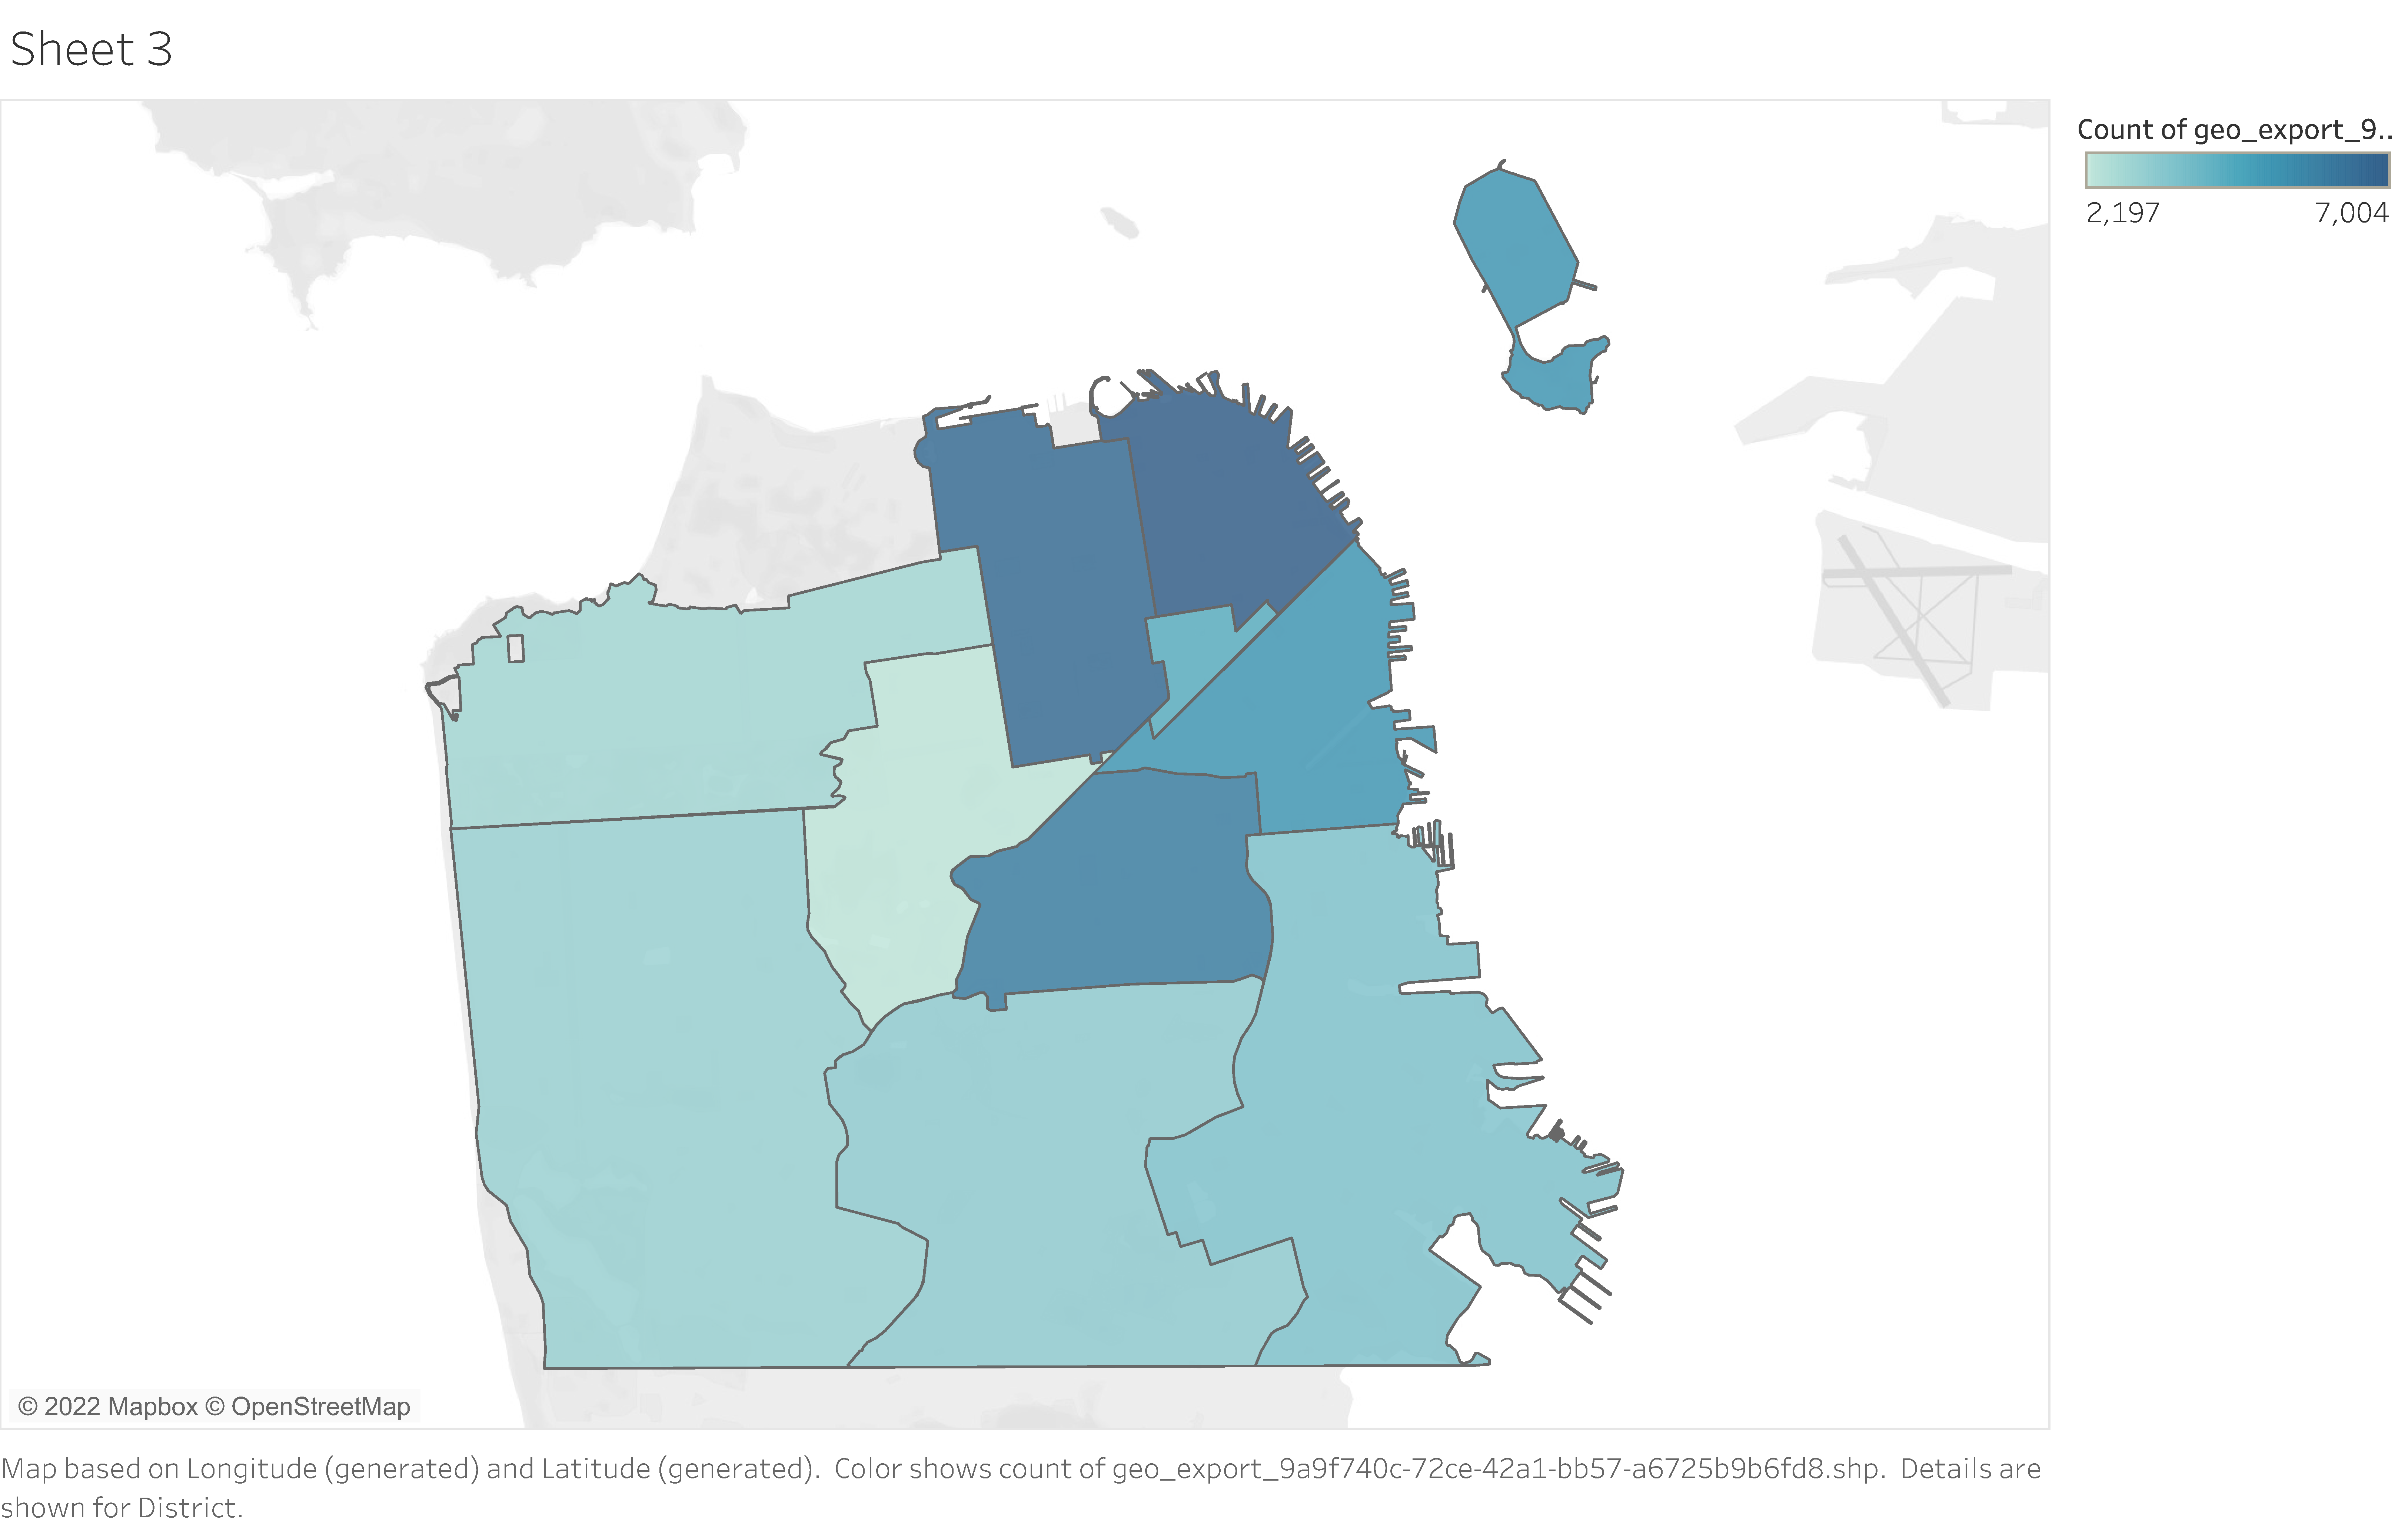
With this map, there’s some work you need to put in before we can touch on the map in the Data Source tab at the bottom left. First, you need to add two different sources of data. Once those are added to the page, they need to be opened and connected by district and police district. Once the tables are connected, you can move on to the actual map.
Making the map portion is simple enough with dragging, dropping, and playing around. The fun comes in that columns can also be made in Tableau!
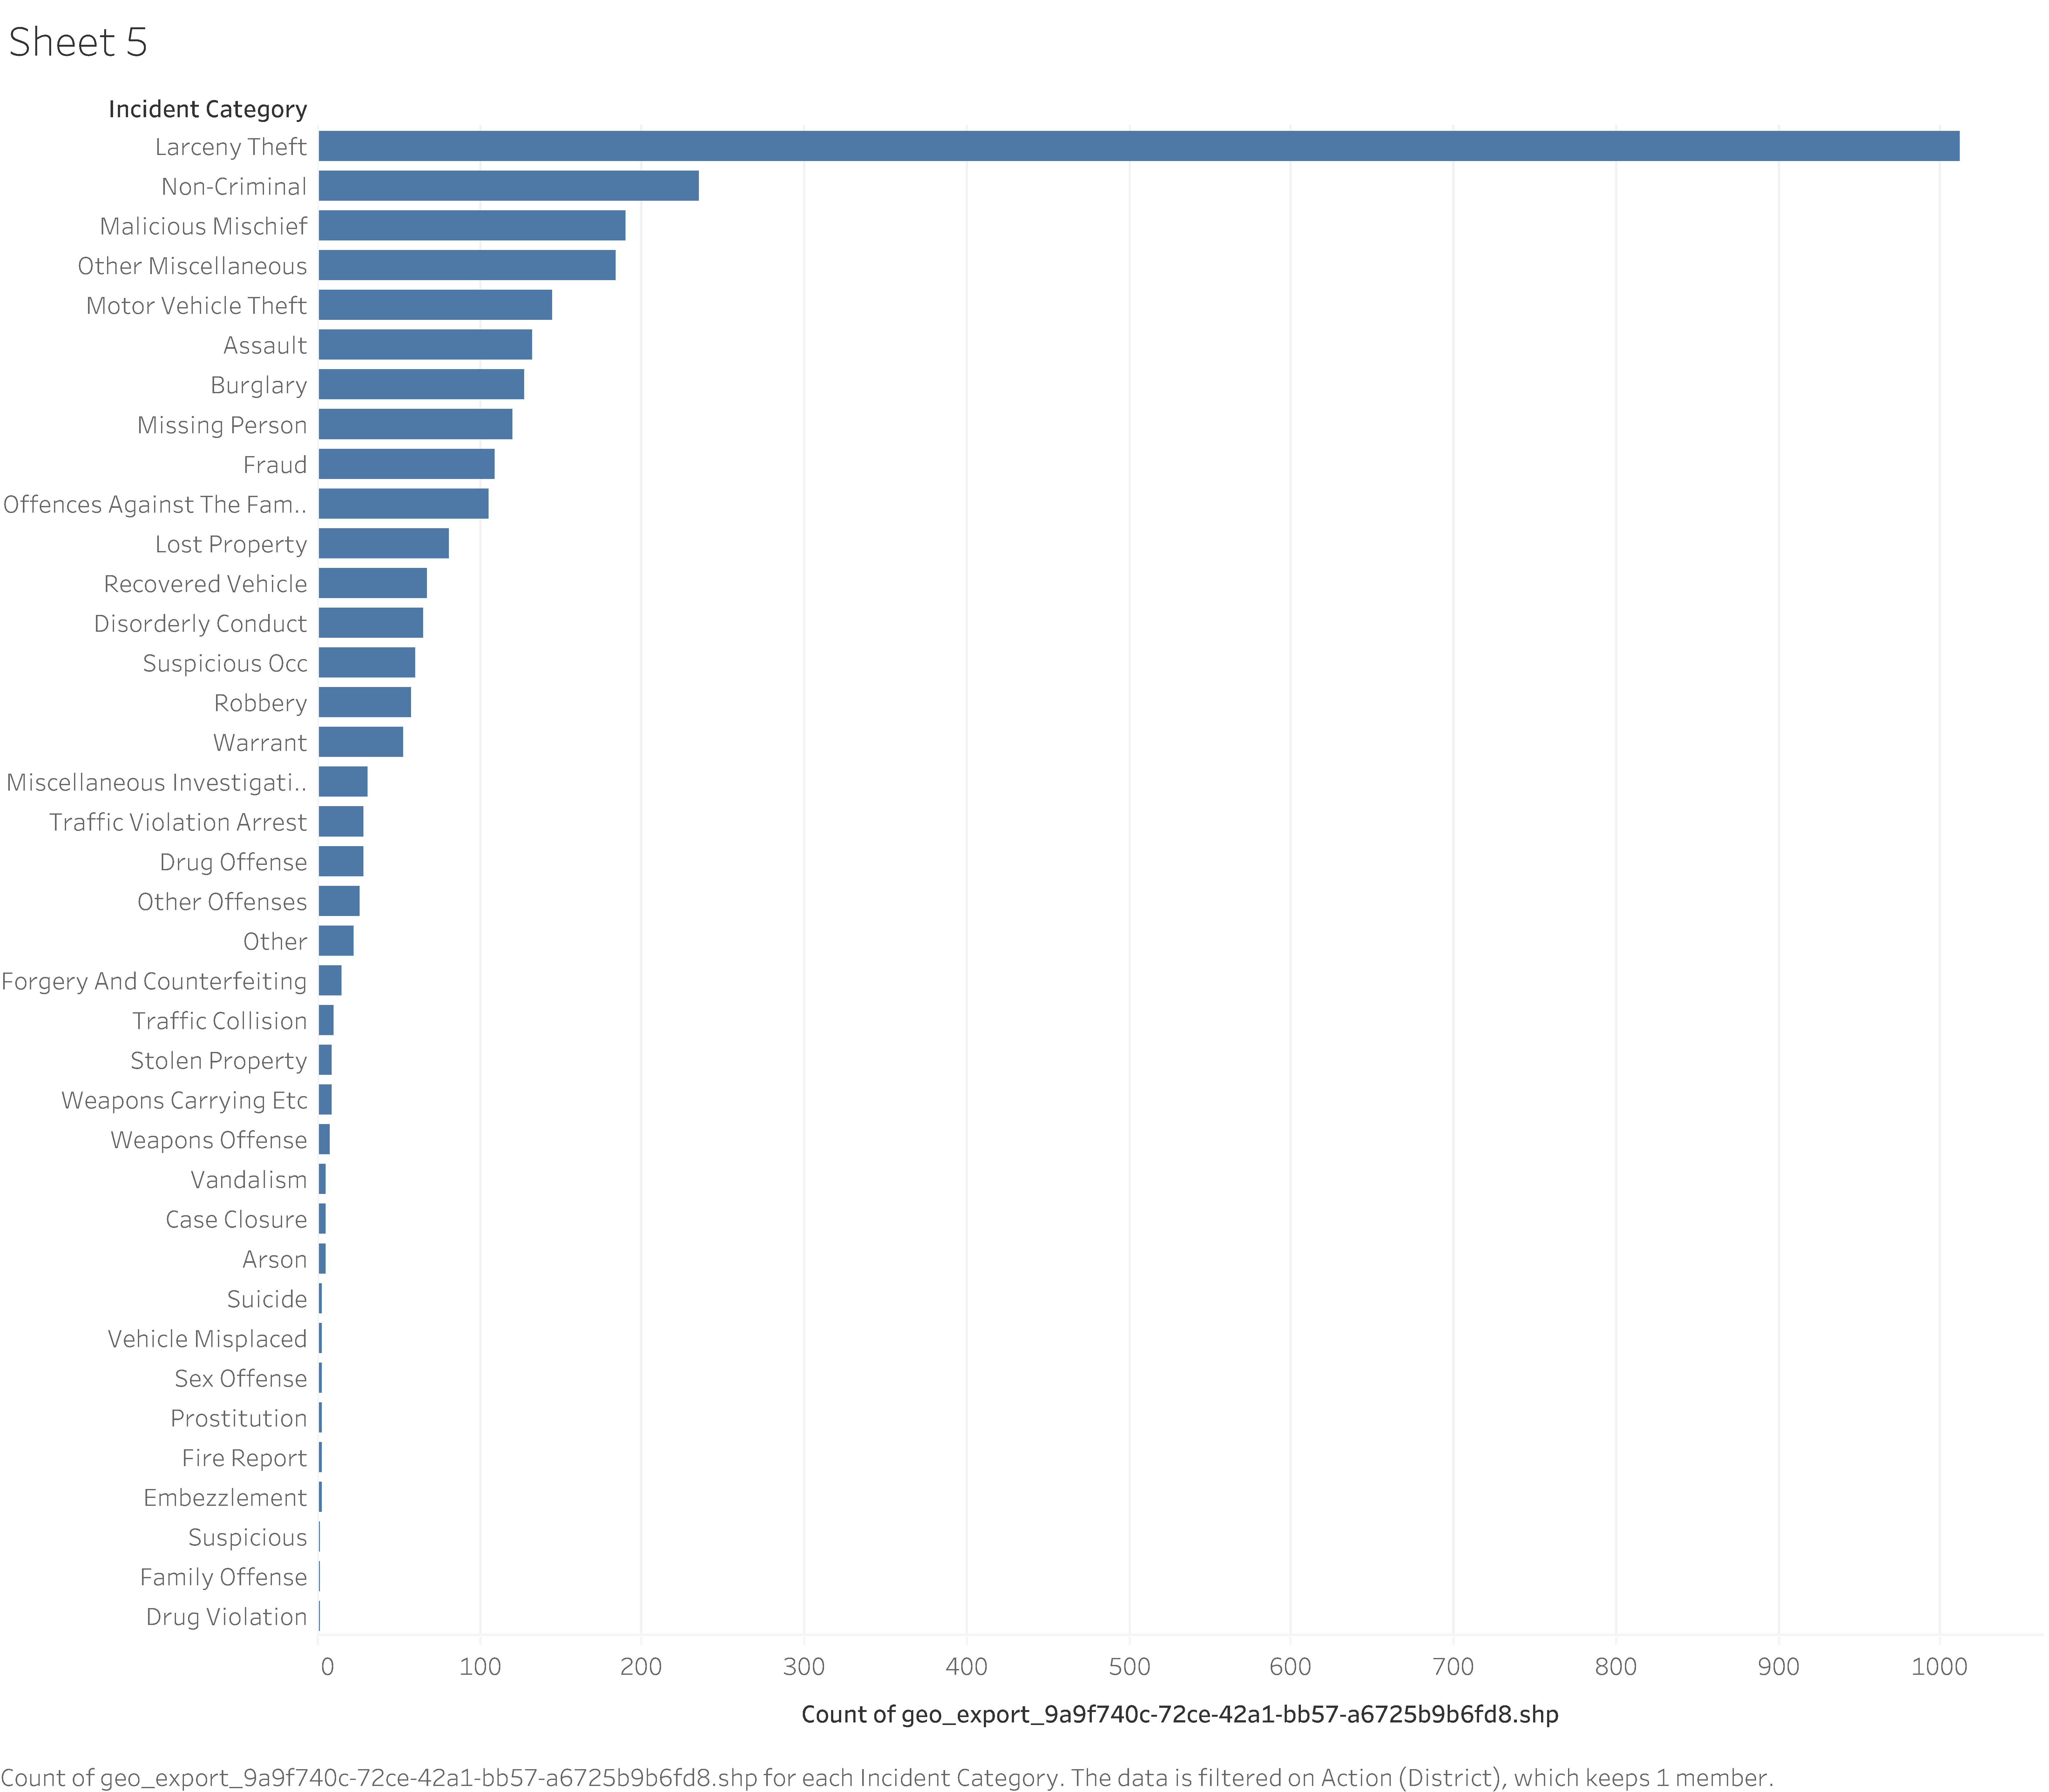
Rows can be made by taking the categories and adding them to the columns and rows at the top of the screen. For this table, Geo was placed in the column area, and the Incident reports were placed in the row area. If you toggle and play around with it enough, you will definitely get the hang of it!
Last and certainly not least was map number 4.
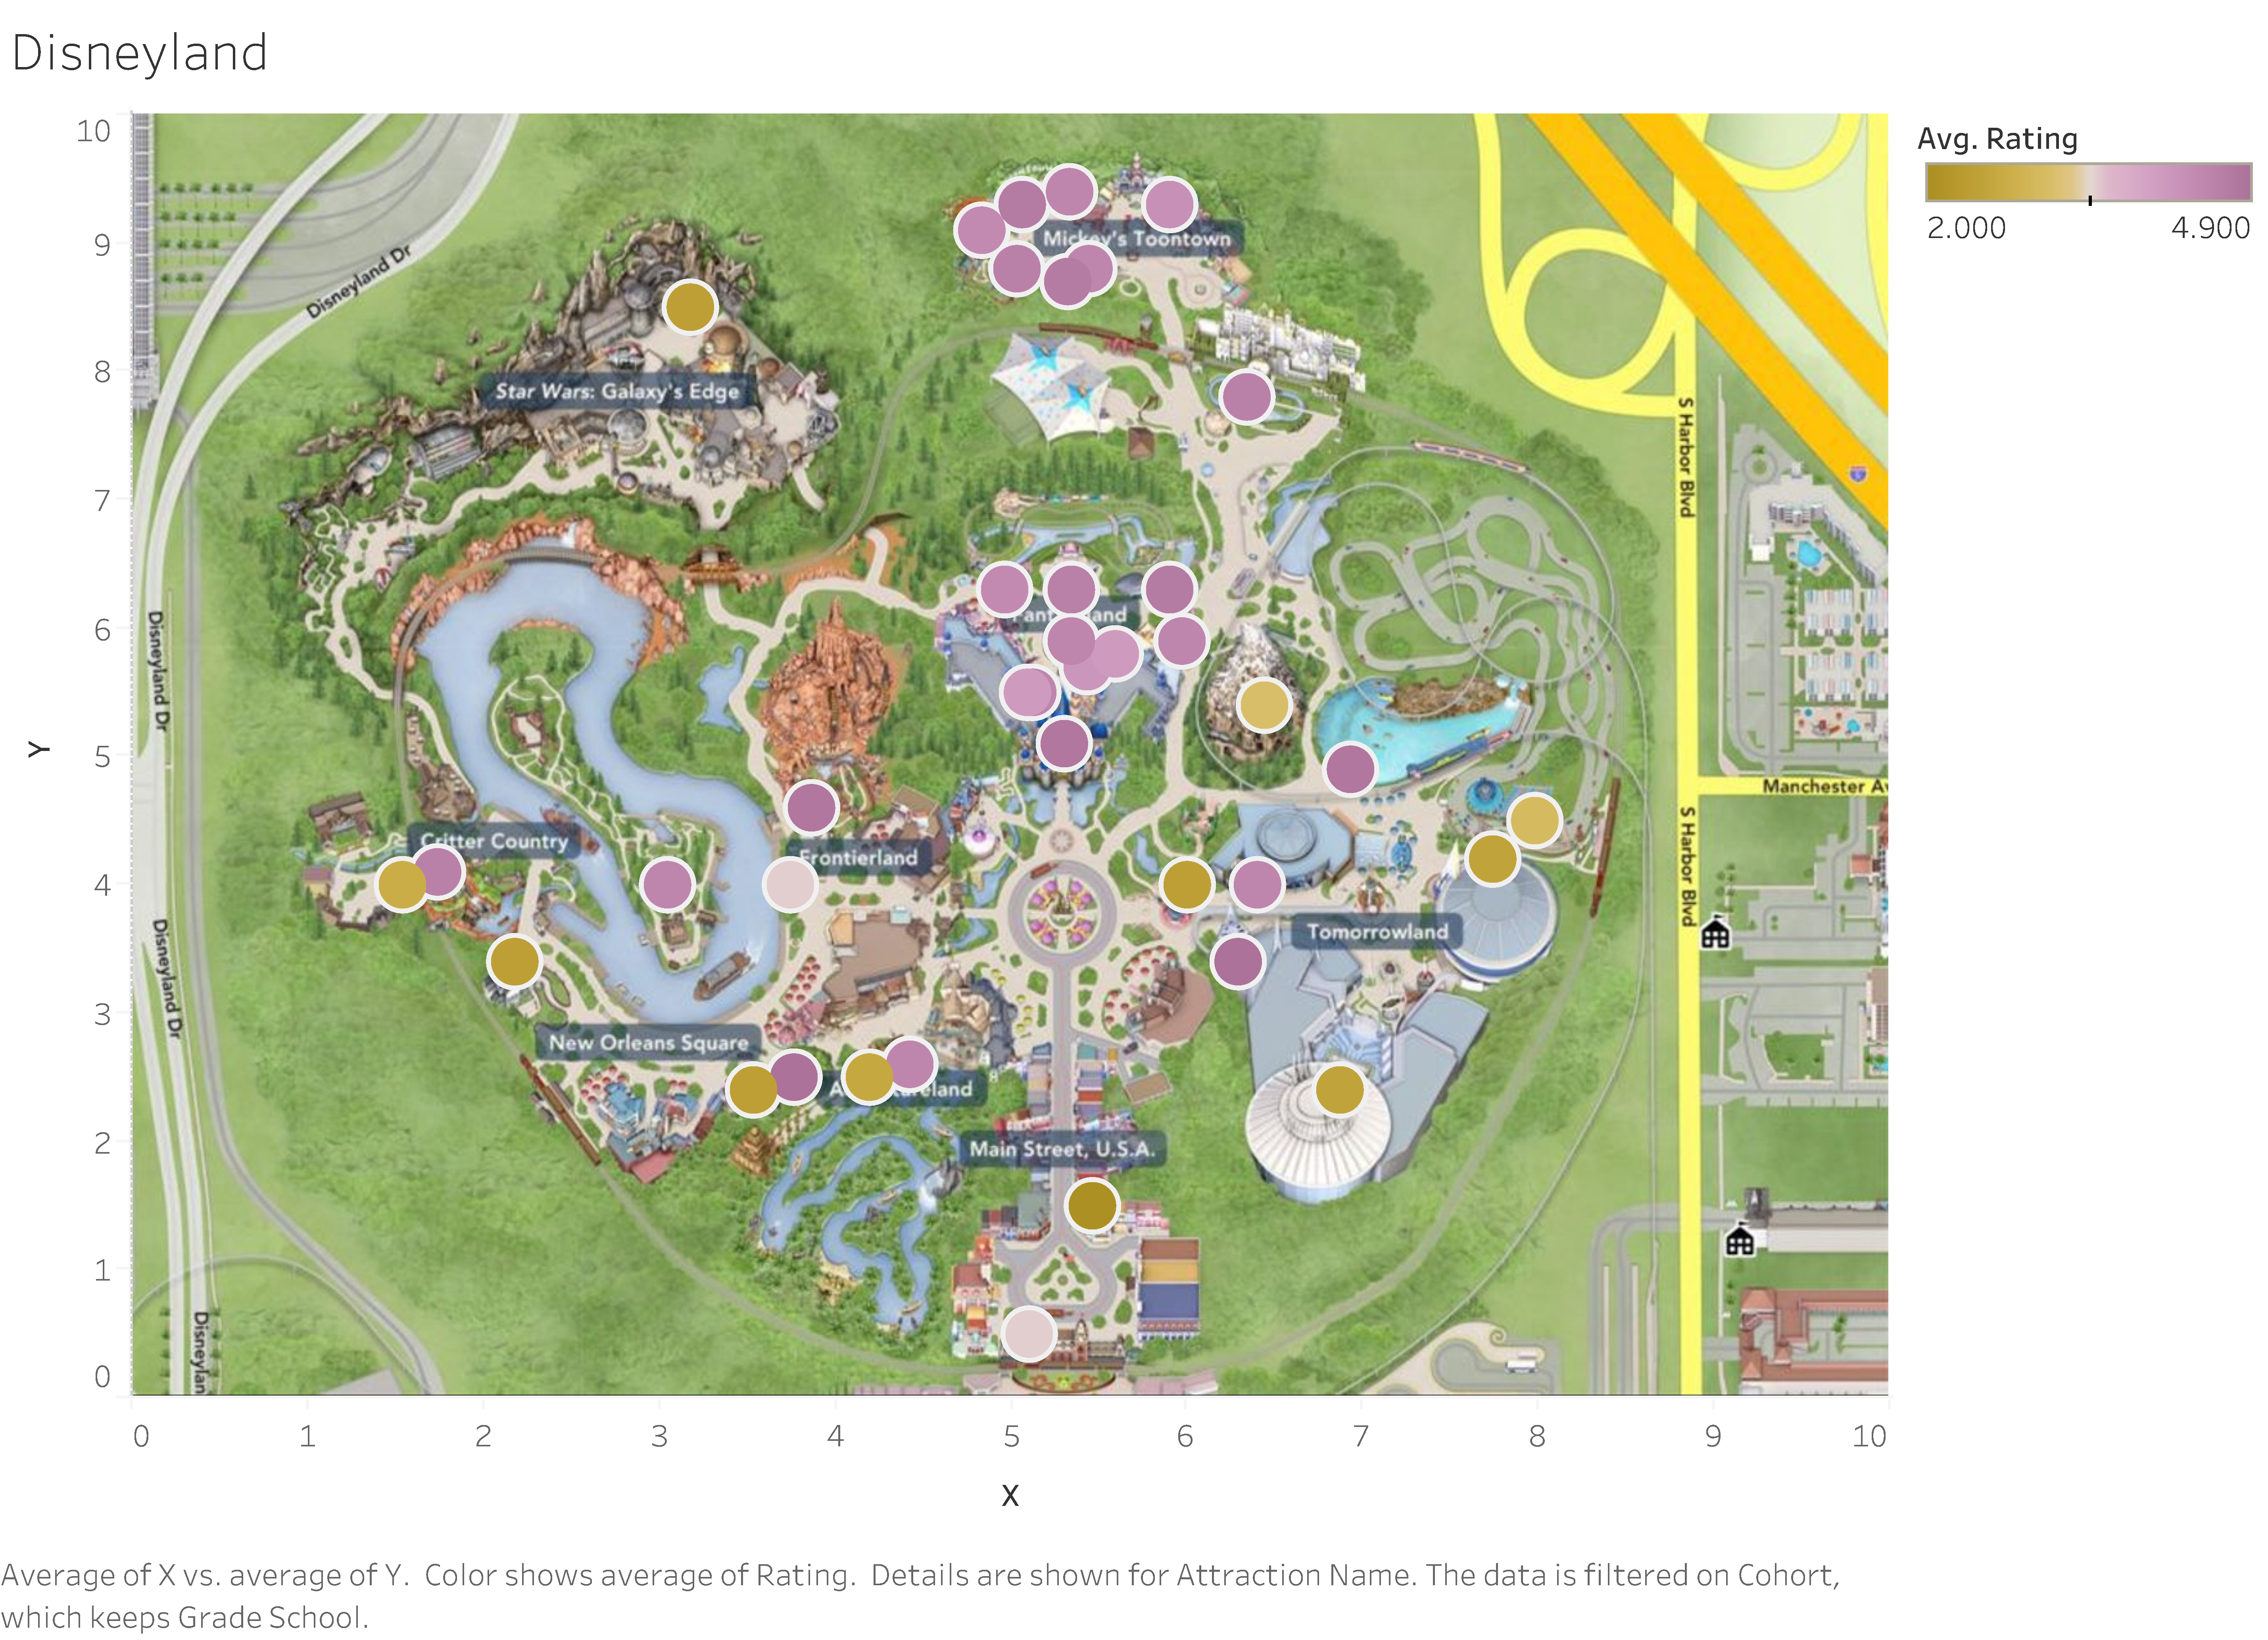
This map is utilizing your own maps, instead of the regular maps on Tableau. First, you must upload the image you want to use. For this, click on the map tab and go to background images, and pick the map image of your choice. Then, return to the map tab, and go to background maps. You must set this to none so your personal map shows up. It will not otherwise. From there Kumar’s video will walk you through the steps needed to set up this map. I admit this map was a bit trickier than others and required me to toggle with the settings that weren’t automatically set up, but this may differ between people, so good luck!
The most important part of this section is the filters. For this, you’re just going to drag the category for cohort and label its filter. From there you toggle the settings to make filters and add the gradient of your choosing. This will show up on the far right, but can be moved around as you please! For more specific filters, just scroll to the far left where the filters button exists, hit the down menu, and set it to individual filters. This will filter your map overall based on your specified filters.
It’s definitely a lot of work, so just make sure you have that dual-screen and you watch side-by-side to get the hang of it. Once you’ve mastered the basics, you’ll be making fun interactive maps in no time!